NFP Balance Sheet Report
A Balance sheet, also called a Statement of Financial Position, provides critical insight into an organization's financial health and resources at a specific point in time—typically the end of a month, fiscal quarter, or year.
Benefits of this report:
-
Financial snapshot: The Balance Sheet Report categorizes a non-profit's financial resources into asserts, liabilities, and net assets, giving stakeholders the information they need to assess a non-profit's liquidity, solvency, and financial stability.
-
Key information for stakeholders: The Balance Sheet Report provides an easy way to deliver critical financial information to relevant stakeholders such as creditors, the board of directors or management, and donors and grantors.
-
Transparency: The Balance Sheet Report is useful for compliance and reporting, as non-profits often need to submit balance sheets for tax filings and to comply with regulations.
| On This Page |
Mapping and Filtering.
Mapping
The following mapping can be changed accordingly in the Mapping Sheet of each report.
| Report Section | Account Group |
| Cash & Cash Equivalents | 1333 |
| Investments | 1503 |
| Accounts Receivable (Net) | 1293 |
| Inventory | 1335 |
| Fixed Assets (Net) | 1500 |
| Other Assets | 1501 |
| Short-term Liabilities | 1253 |
| Long-term Liabilities | 1256 |
| Other Liabilities | 1306 |
| Net Assets | 1219 |
| Operating Revenue | 1249 |
| Expenditures | 1438 |
Filtering
You can filter the Balance Sheet Report based on the following categories:
-
Company (Tenant ID)
-
Year
-
Month
-
Parent Fund
-
Budget (for some reports only)
-
Fund
-
Book
-
Department
-
Projects
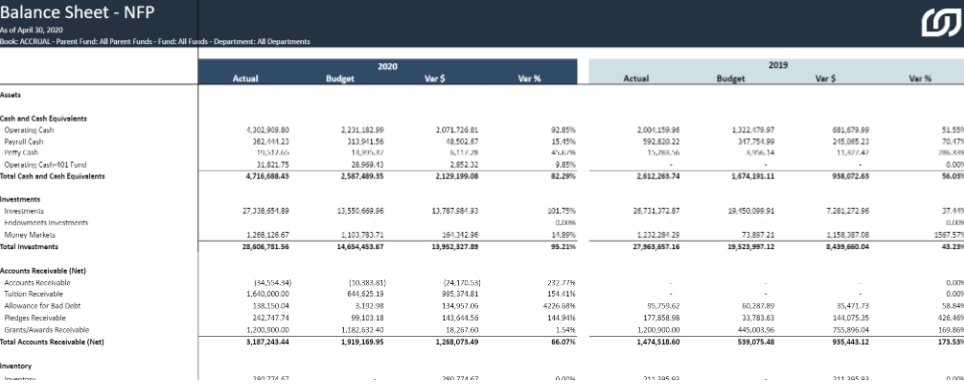
Statement of Financial Position
Balance Sheet
This Statement of Financial Position compares budget versus actual costs to determine whether spending is under control or exceeding a budget in a given area of the organization.

Balance Sheet Forecast
The Balance Sheet Forecast shows the actual spending in a previous month and the budget data in a future month (the forecast) to get an expected total for the year. The month entered in the Selection page is used as the cut-off for the report. Anything before this month contains actual data, while the remaining months are based on the budget data. The Balance Sheet Forecast Report provides a picture of the entire year by comparing actual spending to budgeted future spending to get an expected total for the year.