Balance Sheet
On this page:
The Balance Sheet report type is a financial statement that shows a company's financial position (Assets, Liabilities & Equity) at a specific point in time.
Benefits:
-
Assessing financial position: The balance sheet provides a snapshot of a company's financial position at a specific point in time. This information can be used to assess the company's solvency, liquidity, and financial stability.
-
Evaluating financial performance: The balance sheet can be used to evaluate a company's financial performance over time. For example, by comparing the balance sheet to previous years, you can see how the company's assets, liabilities, and equity have changed.
-
Making informed decisions: The balance sheet can be used to make informed decisions about a company's operations, investments, and financing.
Balance Sheet
This report is the classic Balance Sheet Statement format that also includes the previous year's selected period.
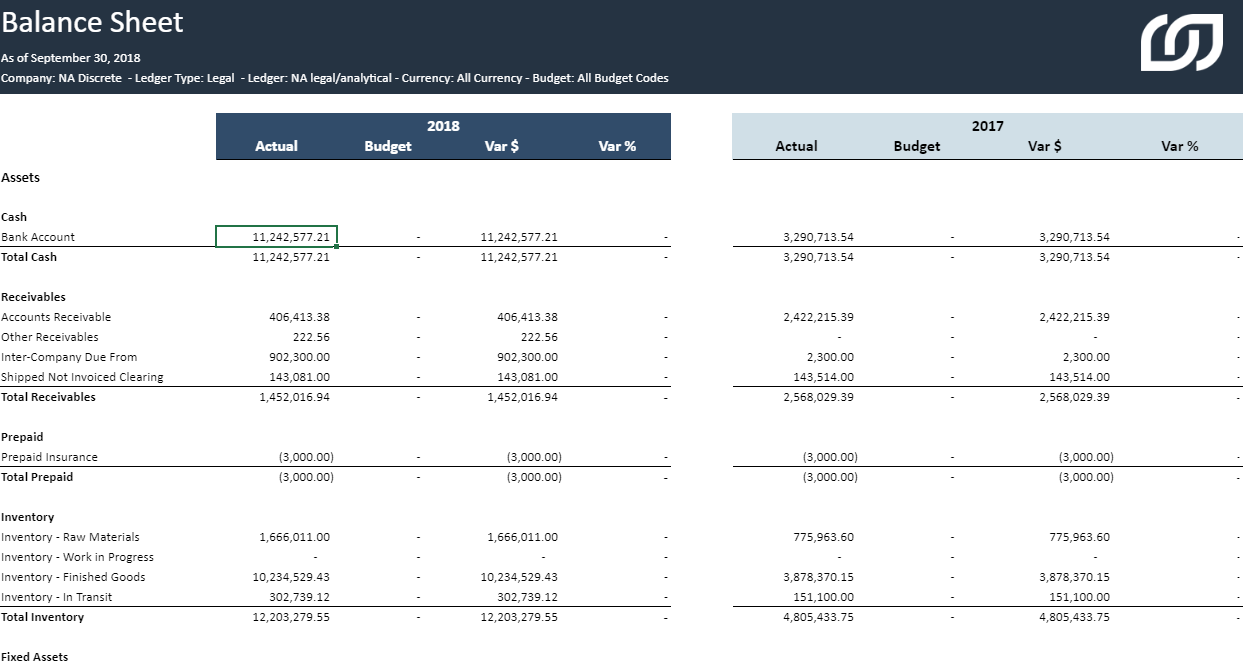
Key metrics at a glance:
-
Actual: This column shows the actual balance of each account for the selected period
-
Budget: This column shows the budgeted balance of each account for the selected period
-
Var $: This column shows the variance between the actual and budgeted balance for each account, calculated as Actual - Budget
-
Var %: This column shows the percentage variance between the actual and budgeted balance for each account, calculated as (Var $ / Budget) * 100.
Mapping and Filtering
Selection Page:
-
Company
-
Fiscal Year
-
Fiscal period
-
Ledger
-
Ledger Type
-
Budget
-
Mapped Dimension 1
-
Mapped Dimension 2
-
Mapped Dimension 3
Balance Sheet Forecast
This report is a Balance Sheet Statement for the full fiscal year (by month), including actuals and forecast.
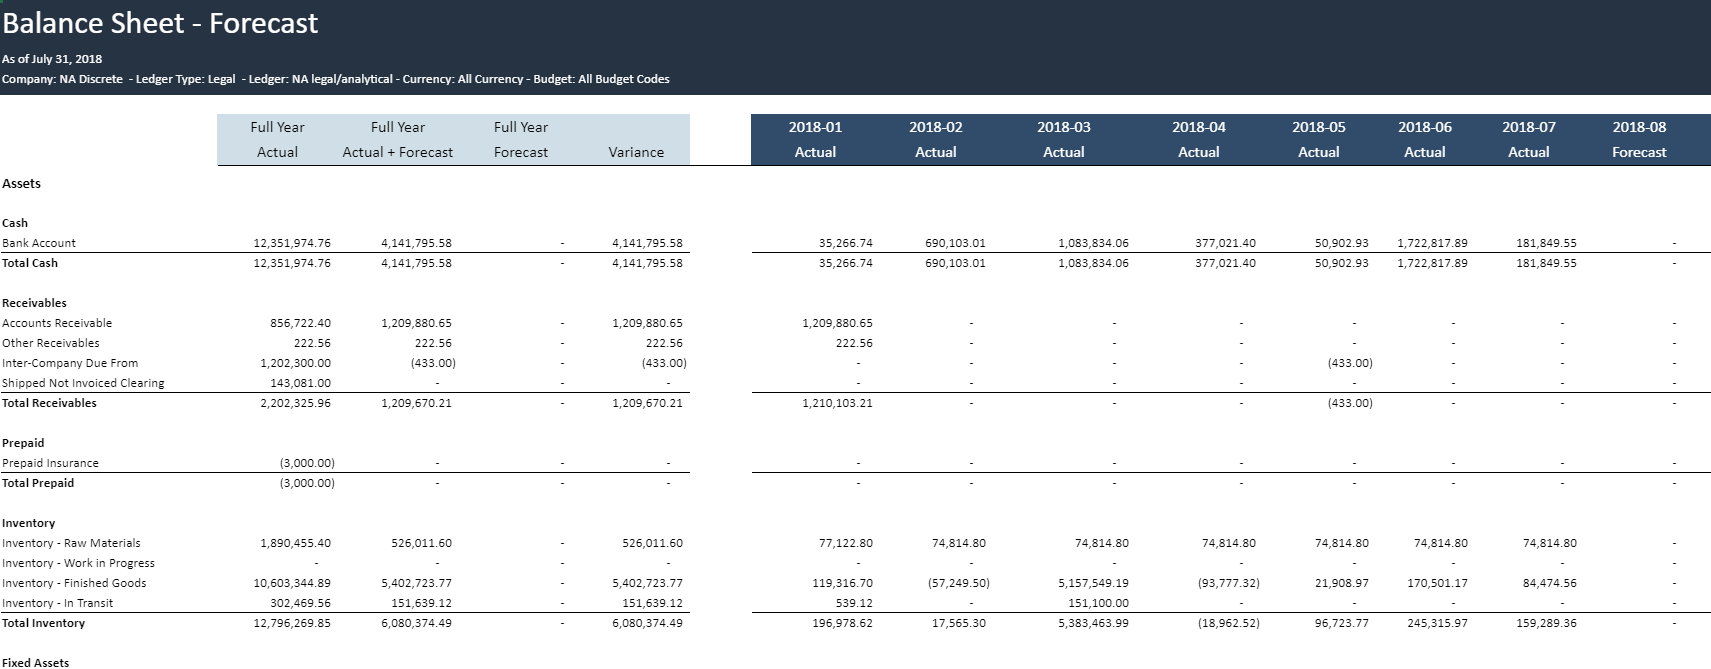
Key metrics at a glance:
-
Full Year Actual: Shows the actual balance of each account for the full year.
-
Full Year Actual + Forecast: Shows the combined actual and forecast balance for each account.
-
Full Year Forecast: Shows the forecast balance for each account for the full year.
-
Full Year Variance: This column shows the variance between the actual and forecast balance for each account.
Mapping and Filtering
Selection Page:
-
Company
-
Fiscal Year
-
Fiscal period
-
Ledger
-
Ledger Type
-
Budget
-
Mapped Dimension 1
-
Mapped Dimension 2
-
Mapped Dimension 3
Balance Sheet - Rolling 12 Month
This report shows the Balance Sheet Statement for the last 12 months (from the selected period), showcasing the ending balance of each account, which is also known as Trailing 12 months (TTM).
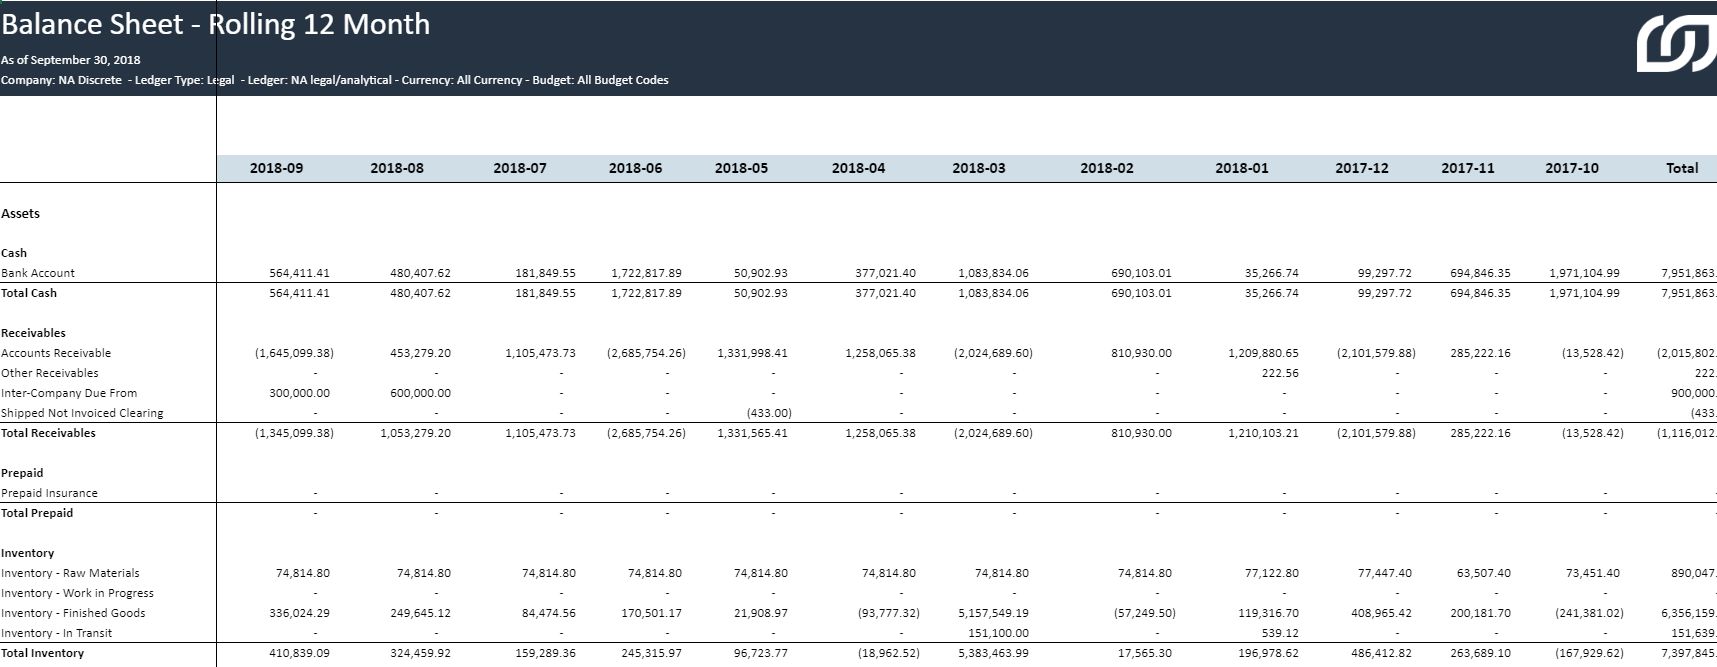
Key metrics at a glance:
-
Year-Month: This column shows the Ledger Posting of each account for the period.
Mapping and Filtering
Selection Page:
-
Company
-
Fiscal Year
-
Fiscal period
-
Ledger
-
Ledger Type
-
Budget
-
Mapped Dimension 1
-
Mapped Dimension 2
-
Mapped Dimension 3