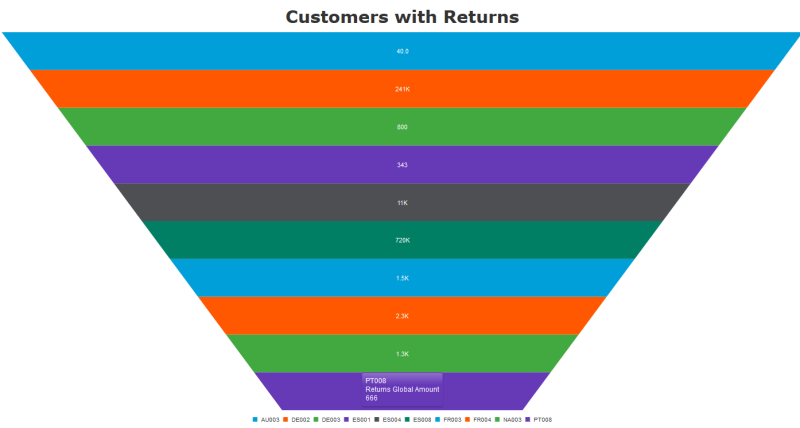
Funnel
A Funnel chart is ideal to display how Input/Output (I/O) reduces with time.
If the top of the chart shows 100% of, for example sales prospects, the bottom could represent Invoiced Sales, and be more reduced than the prospects. That gives it a funnel shape, and can show as many steps as desired in between.
|
Funnel Options
|
|
|
|
|
|
Dynamic Height |
When activating the dynamic height, the steps of the funnel have an area proportional to their value, otherwise, they have the same height. |
|
Dynamic Slope |
The Dynamic Slope option will make the last step a rectangle and adjust the funnel slope from the top to the bottom. |
|
Neck ratio |
If Dynamic Slope is deactivated you can set this ratio to determine the slope. |
|
|
|
|
Series
|
|
|
|
|
|
Slice Field Name |
To indicate the Measure on which the chart is created. |
