Charts
In many circumstances a visual representation of data can be very useful and revealing.
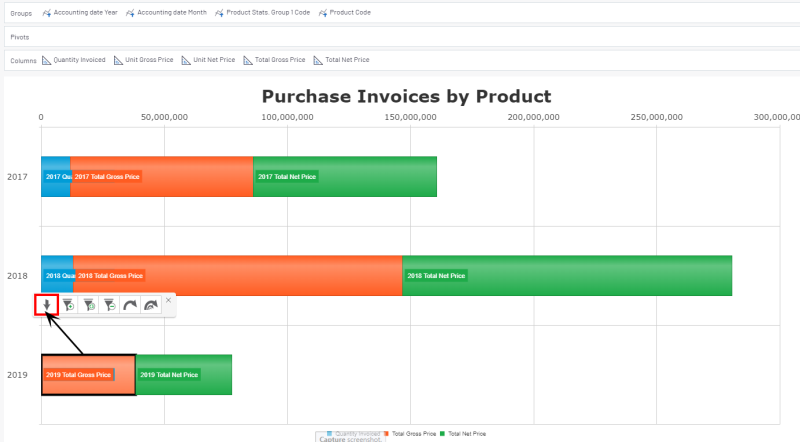
The NectariChart Views gives the user the possibility to easily create customized and high quality Charts. Furthermore, it provides powerful drill-down features to dynamically navigate in the Charts and analyze data at a more detailed level.
Nectari has an extensive choice of Charts.
To change the View to a Chart:
- Click on
and select the type of Chart desired.
- Customize the layout (e.g. theme, chart title, labels, legend, etc.) of the rendered Chart by clicking on
.
