Map View
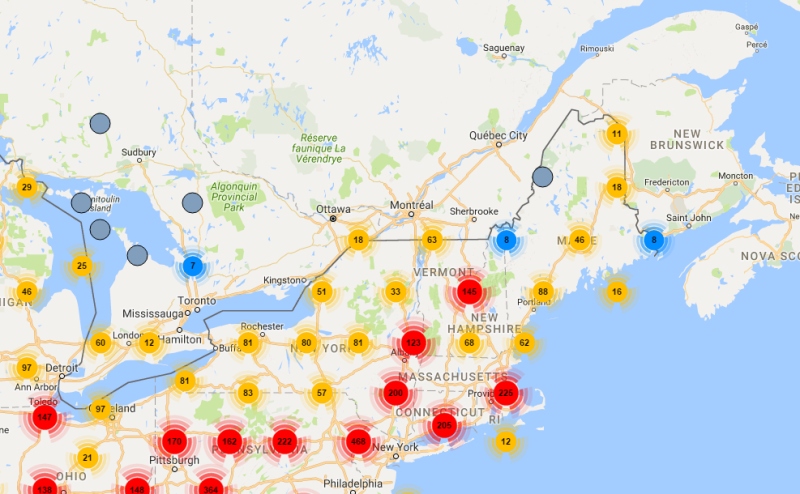
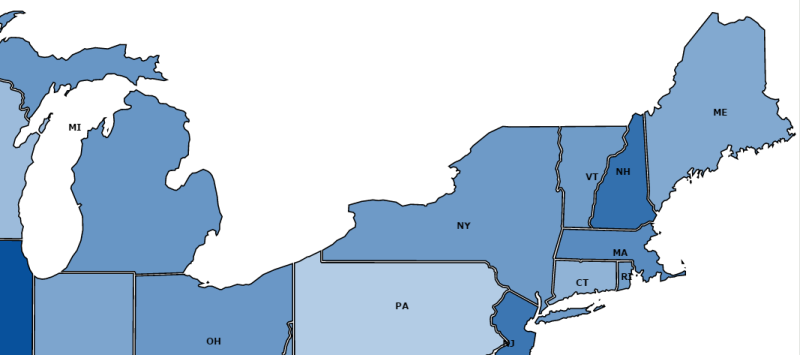
The Map View is a visual tool to represent values geographically by customizing the content and the layout of the data.
Two Fields are mandatory in order to load a map. The Data Model definition must include Fields that have longitude and latitude information so they can be bound to the Google Map properties.
Maps do not work with Pivot fields. All the Fields selected must be in Groups or Columns in the Organizer section.
Each map has its own distinct properties that can be personalized.
When saving a map the current position and zoom level will be saved as the opening position.
Properties for maps created with Google Maps.
|
General
|
|
|
|
|
|
What field defines the latitude |
To select the Field of the Data Model with Latitude information. |
|
What field defines the longitude |
To select the Field of the Data Model with Longitude information. |
|
Map type |
To choose a type of map available on Google API (Roadmap, Satelite, Hybrid or Roadmap with Terrain). |
|
Clusters |
To gather or not markers into Clusters to avoid overlapping of clumped data points. |
|
Heat Map |
To turn on Heat Map instead of a marker. When activated, a new Heat Map Properties section appears, requiring the values from a Field to add Weighting to Heat Map data points. |
|
Show Drill Down Controls |
To show or hide the Drill Down controls from the map. |
|
Reverse data |
For displaying purposes, it might be useful to reverse positives and negatives. |
|
|
|
|
Theme
|
|
|
|
|
|
Feature Colors
|
|
|
|
|
|
Landscape Color Visible |
To change the default color of the map for land by the chosen one. |
|
Landscape Color |
To choose a color for the land. |
|
Water Color Visible |
To change the water default color. |
|
Water Color |
To choose a color for the water. |
|
Road Color Visible |
To change the road default color of the map. |
|
Road Color |
To choose a color for the roads. |
|
|
|
|
Marker Color
|
|
|
|
|
|
Icon Type |
The Icon type can be simply based on values or based on a color field. |
|
Simple Icon |
|
|
|
|
|
Detailed Info Window
|
|
|
|
|
|
Info Row 1-5 |
Up to 5 rows of information can be displayed on the markers. Associate the rows to the desired fields to display that information. |
|
|
|
|
Auto Refresh
|
|
|
|
|
|
Groups
|
|
|
|
|
There is a small control at the bottom of the map to enable moving and zooming.
Properties for vector maps.
|
General
|
|
|
|
|
|
Map background color |
To select a color for the background of the map. |
|
Region label color |
To select a color for the regions labels. |
|
Region low scale color |
To choose a color for the low end of the scale (The scale is automatically calculated between two colors, any colors.) |
|
Region high scale color |
To choose a color for the high end of the scale. |
|
Show region labels |
To show or hide the region labels of the map. |
|
Show legend |
To show or hide the legend, which is in the color scale. |
|
Country or State field |
To select the field defining the Countries (in a continental view) or States (State or County or Province or District) in a country view. |
|
Region color based on |
To choose the field that feeds the data to base the view on. |
|
Reverse data |
For displaying purposes, it might be useful to reverse positives and negatives. |
|
|
|
|
Theme
|
|
|
|
|
|
Region Details
|
|
|
|
|
|
Auto Refresh
|
|
|
|
|

