Database Engine Performance
Once you have made sure that Nectari is not the source of the performance issues, and are still having issues you might want to check your Database Engine performance.
In the case of a SQL Server, the elements of interest are the Memory and the Disk I/Os.
The following can be done to determine where the performance issue comes from.
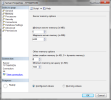
- Check the Database Server Memory settings to make sure that the Maximum Server Memory
parameter is not set to use the whole server’s RAM capacity. Note
Allowing this could affect other applications or services running on the server by limiting their memory. The proper setting depends on the server’s RAM capacity and the installed applications on the server.
ExampleA situation where the server only has the Database Engine (SQL Server) installed is considered different from a situation where there are also applications installed on the server in addition to the Database Engine.
It is hence recommended to contact a technical specialist to determine the most appropriate setting to use.
- In general, allowing the SQL Server to use
up to 80% memory capacity seems to improve performance, even though you could get more
improvement with a more situation-specific setting.

- Run Performance Monitor (PerfMon) with the following Counters set to collect useful
information and determine the source of the performance issue. Note
This could be done for a 15 minute period to get a good overview of how the resources are utilized. However, contact a technical specialist to help you determine the correct time for your specific situation.
- Set up a Performance Monitor (PerfMon) counter to monitor the Pages per Second
counter, which indicates the number of times there is reading/writing access to the disk
because of insufficient memory. Note
A high number of Pages per Second (more than 150) for a relatively long time implies a lack of memory on the server most of the time. However, you should contact a technical specialist to help with the interpretation of this indicator because high Pages per Second value could also be caused by some other issue.
- Set up a Performance Monitor (PerfMon) counter to monitor the Page Life Expectancy
(from SQL Server Buffer Manager) counter, which indicates the time that a piece of
information (page) stays in the buffer pool (part of memory cache). Note
The higher the Page Life Expectancy, the better the performance on the server. A minimal value for this counter should be 300 seconds (5 minutes). Under that value, you might be dealing with a lack of memory.
- Set up a Performance Monitor (PerfMon) counter to monitor the Average Disk Queue
Length counter, which indicates the number of I/O requests waiting in the queue to
access the disk for reading or writing purposes. Note
An Average Disk Queue Length greater than 2 indicates more disk delay than expected most of the times. This might be caused by the fact that the disk speed is not appropriate.
- Set up a Performance Monitor (PerfMon) counter to monitor the % Processor Time
counter in the Performance Monitor windows.Note
A high percentage value of Processor Time (more than 70%) indicates a lack of processing power.
Contact a technical specialist for more information.
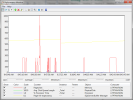
The following pictures illustrate what it looks like to monitor performance with the
Counters presented above in two Viewing Modes: Line and Report.
It is recommended to contact a technical specialist to analyze such situations.