Balance Sheet
Financial statement that shows a company's financial position (Assets, Liabilities & Equity) at a specific point in time.
Benefits:
-
Assessing financial position: The balance sheet provides a snapshot of a company's financial position at a specific point in time. This information can be used to assess the company's solvency, liquidity, and financial stability.
-
Evaluating financial performance: The balance sheet can be used to evaluate a company's financial performance over time. For example, by comparing the balance sheet to previous years, you can see how the company's assets, liabilities, and equity have changed.
-
Making informed decisions: The balance sheet can be used to make informed decisions about a company's operations, investments, and financing.
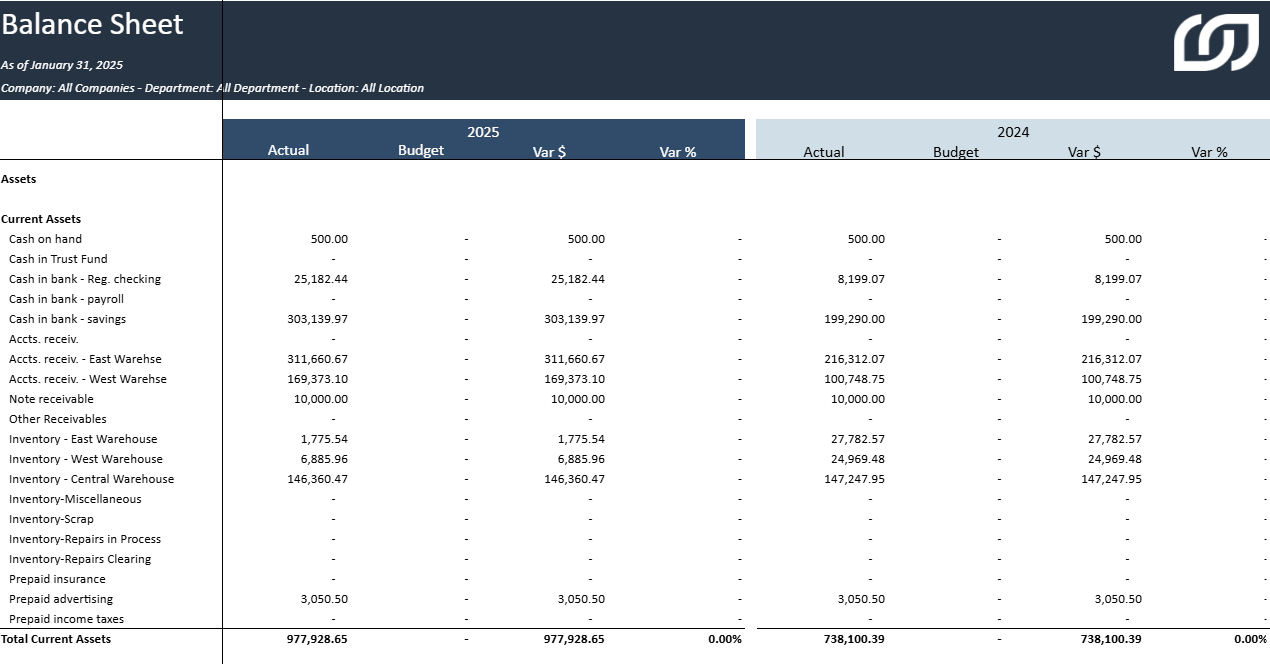
Balance Sheet
Classic Balance Sheet Statement Format that also includes the previous year's selected period.
Key metrics at a glance:
-
Actual: This column shows the actual balance (Ending Balance Amount) of each account for the selected period
-
Budget: This column shows the budgeted balance (Budget Posting Amount) of each account for the selected period
-
Var $: This column shows the variance between the actual and budgeted balance for each account, calculated as Actual - Budget
-
Var %: This column shows the percentage variance between the actual and budgeted balance for each account, calculated as (Var $ / Budget) * 100
Mapping & Filtering
Mapping
All the reports in the Balance Sheet section have the same report structure that can be customized based on the Account Grouping of Sage 100.
The following mapping needs to be changed accordingly in the "Mapping" Sheet of each report. Note that the account mapping to each Reporting Code is defined in the Reporting Code configuration worksheet, as described here.
| Report Section | Reporting Code |
| Current Assets | 000 |
| Property, Plant, and Equipment | 150 |
| Other Assets | 180 |
| Current Liabilities | 200 |
| Long Term Debt | 275 |
| Equity | 300 |
Selection Page
The selection page offers the following fields:
-
Company
-
Year
-
Period
-
Budget
-
Segment 02 (Department)
-
Segment 03 (Location)
-
Segment 04
-
Segment 05
-
Segment 06
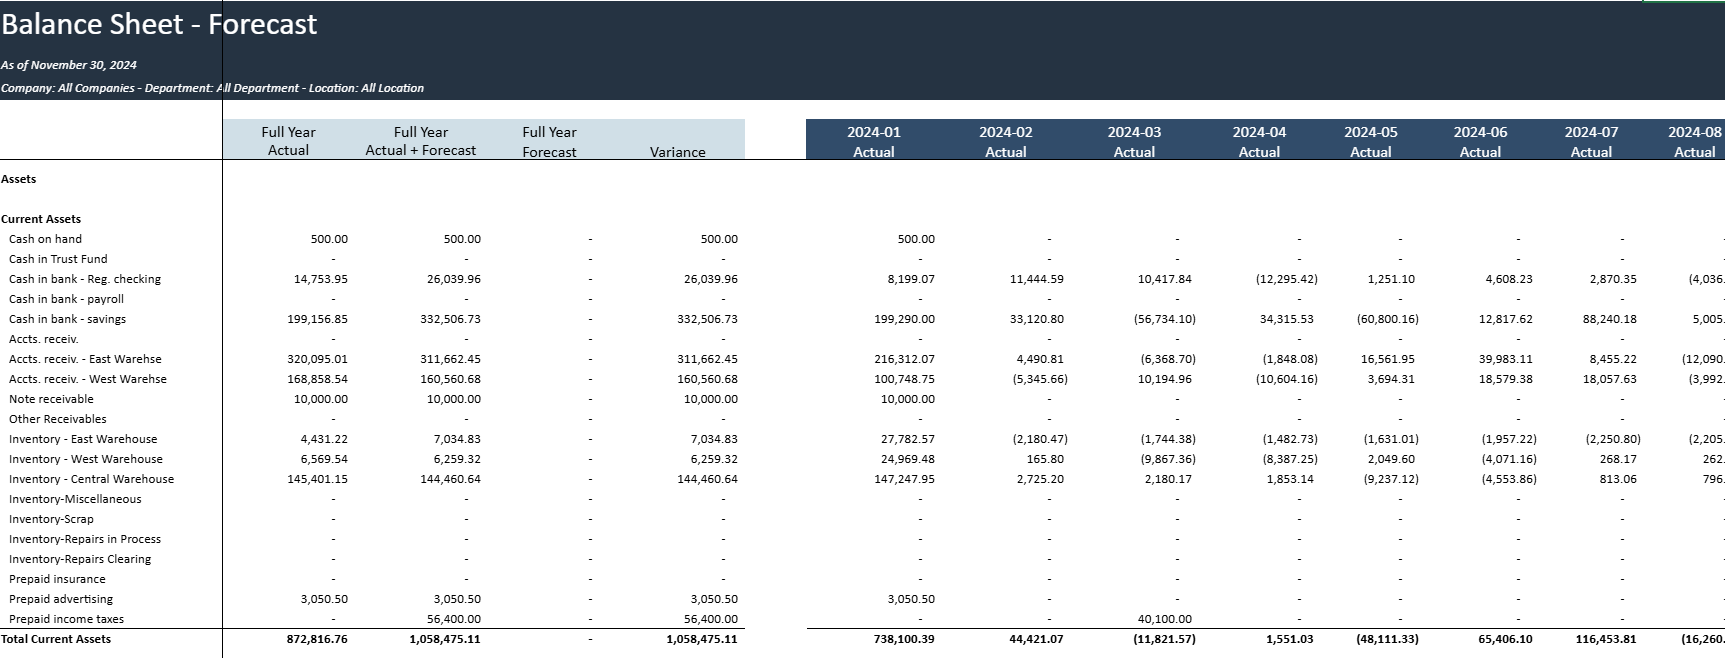
Balance Sheet Forecast
Balance Sheet Statement for the full fiscal year (By month) including actuals and forecast.
Key metrics at a glance:
-
Full Year Actual: This column shows the actual balance (Ending Balance Amount) of each account for the full year.
-
Full Year Actual + Forecast: This column shows the combined actual and forecasted balance for each account.
-
Full Year Forecast: This column shows the forecasted balance (Budget Posting Amount) for each account for the full year.
-
Full Year Variance: This column shows the variance between the actual and forecasted balance for each account
Mapping & Filtering
Mapping
All the reports in the Balance Sheet section have the same report structure that can be customized based on the Account Grouping of Sage 100.
The following mapping needs to be changed accordingly in the "Mapping" Sheet of each report. Note that the account mapping to each Reporting Code is defined in the Reporting Code configuration worksheet, as described here.
| Report Section | Reporting Code |
| Current Assets | 000 |
| Property, Plant, and Equipment | 150 |
| Other Assets | 180 |
| Current Liabilities | 200 |
| Long Term Debt | 275 |
| Equity | 300 |
Selection Page
The selection page offers the following fields:
-
Company
-
Year
-
Period
-
Budget
-
Segment 02 (Department)
-
Segment 03 (Location)
-
Segment 04
-
Segment 05
-
Segment 06
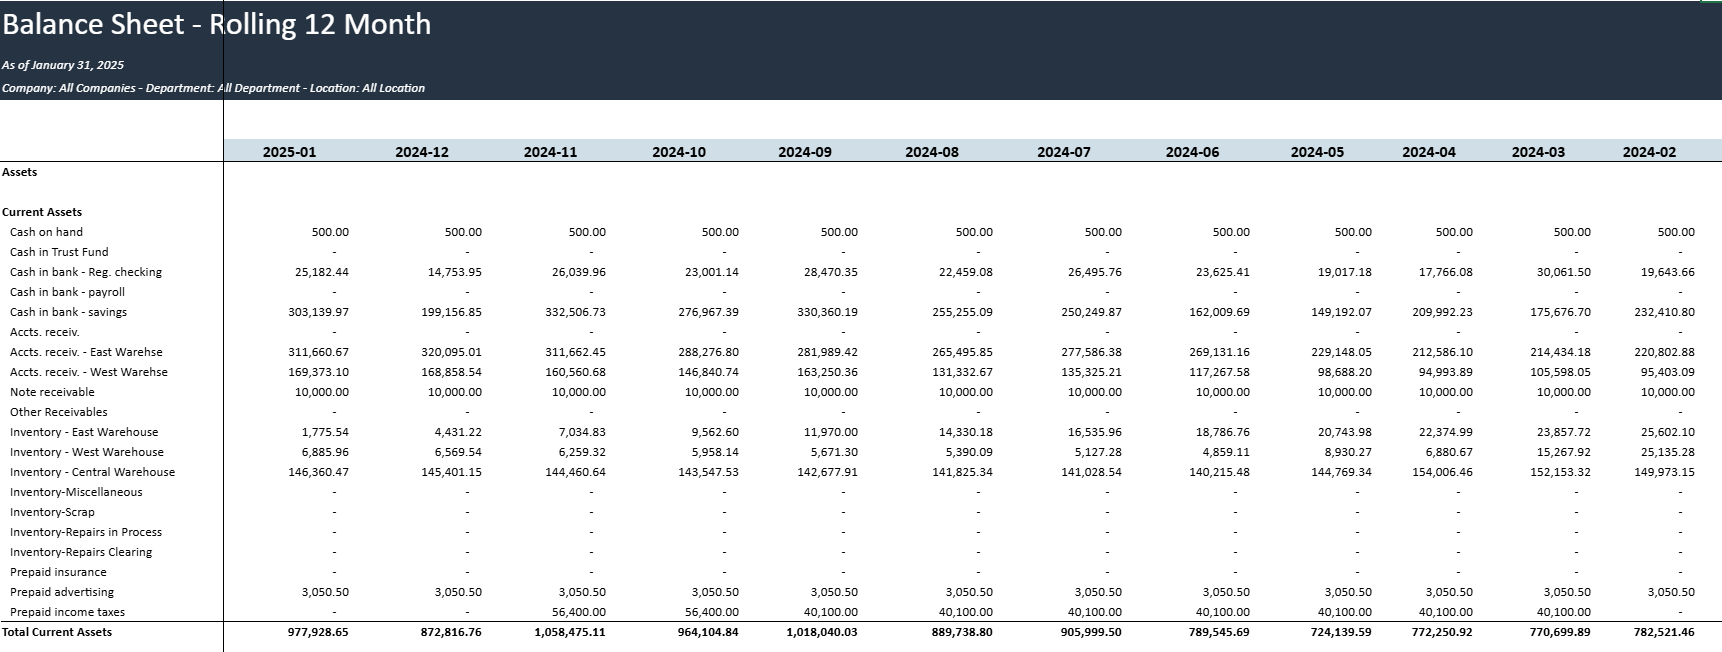
Balance Sheet - Rolling 12 Month
Balance Sheet Statement for the last 12 month (from selected period) showcasing the ending balance of each account, also known as Trailing 12 months (TTM).
Key metrics at a glance:
-
Year-Month: This column shows the Ending Balance Amount of each account for the period.
Mapping & Filtering
Mapping
All the reports in the Balance Sheet section have the same report structure that can be customized based on the Account Grouping of Sage 100.
The following mapping needs to be changed accordingly in the "Mapping" Sheet of each report. Note that the account mapping to each Reporting Code is defined in the Reporting Code configuration worksheet, as described here.
| Report Section | Reporting Code |
| Current Assets | 000 |
| Property, Plant, and Equipment | 150 |
| Other Assets | 180 |
| Current Liabilities | 200 |
| Long Term Debt | 275 |
| Equity | 300 |
Selection Page
The selection page offers the following fields:
-
Company
-
Year
-
Period
-
Budget
-
Segment 02 (Department)
-
Segment 03 (Location)
-
Segment 04
-
Segment 05
-
Segment 06