Profit and Loss
The Profit and Loss report is a financial statement that shows a company's revenues, expenses, and net profit or loss over a specific period of time. It is also known as an Income Statement.
Benefits:
-
Financial performance: Assesses the company's profitability and overall financial health.
-
Trend analysis: Identifies trends in revenue, expenses, and profitability over time.
-
Decision making: Provides insights for making informed decisions about pricing, cost management, and business operations.
-
Investor relations: Helps communicate financial performance to investors and stakeholders.
-
Tax planning: Assists in tax planning and compliance.
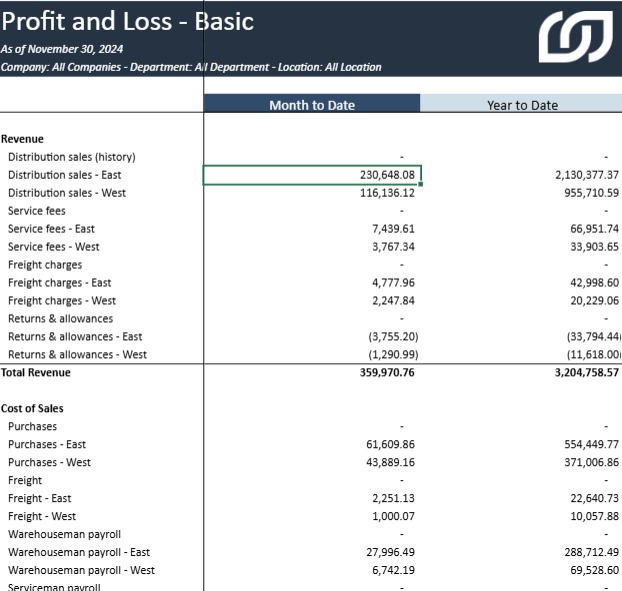
Profit and Loss - Basic
This is the basic profit and loss format, which includes Month to Date and Year to Date fields.
Key metrics at a glance:
-
Month to Date: This column shows the financial performance (GL Posting Amount) for the current month.
-
Year to Date: This column shows the financial performance (GL Posting Amount) for the entire year up to the end of the current month.
Mapping and Filtering
Mapping
All the reports in the Profit and Loss section have the same report structure that can be customized based on the Account Grouping of Sage 100.
The following mapping needs to be changed accordingly in the "Mapping" Sheet of each report. Note that the account mapping to each Reporting Code is defined in the Reporting Code configuration worksheet, as described here.
| Report Section | Reporting Code |
| Revenue | 400 |
| Cost of Sales | 450 |
| Operating Expenses - Central | 500 |
| Operating Expenses | 600 |
| General & Administrative | 700 |
| Other Income & Expense | 950 |
| Provision for Income Taxes | 990 |
Selection Page
The selection page for the basic profit and loss report offers the following fields:
-
Fiscal Year
-
Fiscal Period
-
Segment 02 (Department)
-
Segment 03 (Location)
-
Segment 04
-
Segment 05
-
Segment 06
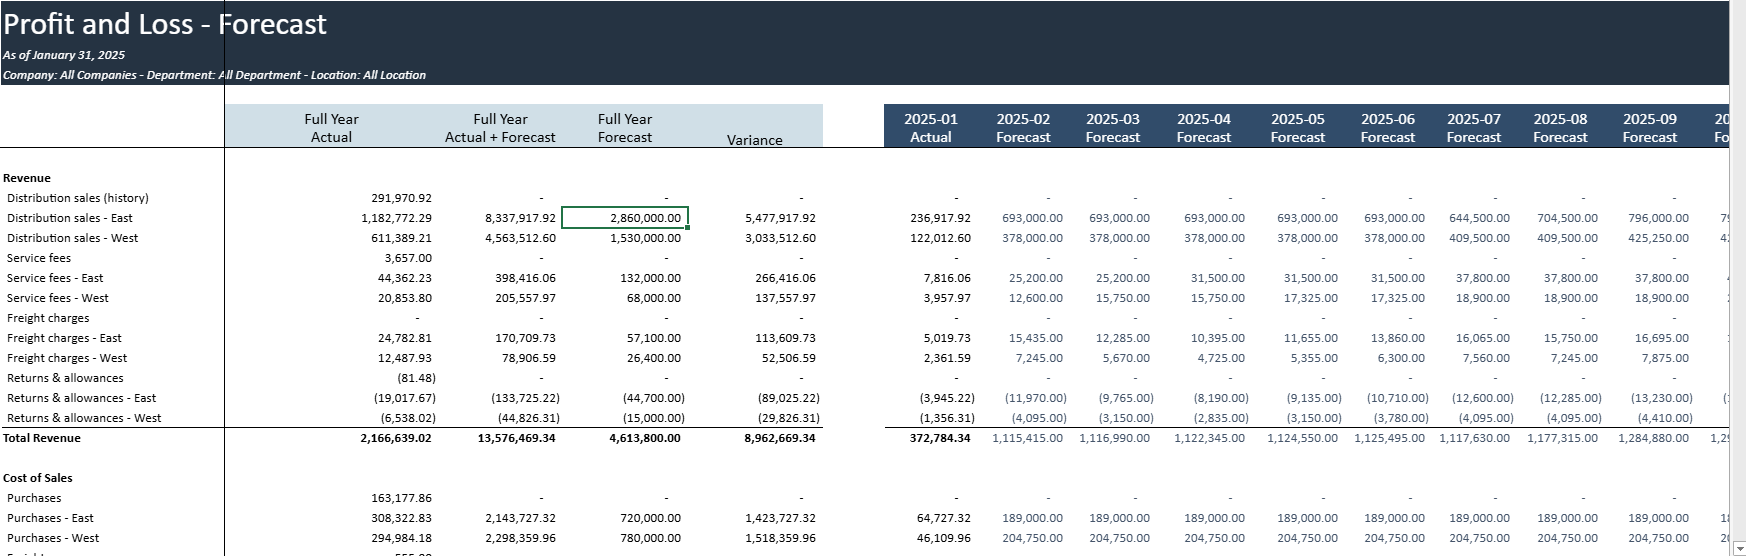
Profit and Loss - Forecast
This is a Profit and Loss Statement for the full fiscal year (by month), including actuals and forecast.
Key metrics at a glance:
-
Full Year Actual: This column shows the actual financial performance (GL Posting Amount) of each Profit and Loss account for the entire year.
-
Full Year Actual + Forecast: This column shows the combined actual and forecasted financial performance of each Profit and Loss account.
-
Full Year Forecast: This column shows the forecasted financial performance (Budget Posting Amount) of each Profit and Loss account for the entire year.
-
Full Year Variance: This column shows the difference between the actual and forecasted financial performance of each Profit and Loss account.
Mapping and Filtering
Mapping
All the reports in the Profit and Loss section have the same report structure that can be customized based on the Account Grouping of Sage 100.
The following mapping needs to be changed accordingly in the "Mapping" Sheet of each report. Note that the account mapping to each Reporting Code is defined in the Reporting Code configuration worksheet, as described here.
| Report Section | Reporting Code |
| Revenue | 400 |
| Cost of Sales | 450 |
| Operating Expenses - Central | 500 |
| Operating Expenses | 600 |
| General & Administrative | 700 |
| Other Income & Expense | 950 |
| Provision for Income Taxes | 990 |
Selection Page
The selection page for the Profit and Loss - Forecast offers the following fields:
-
Company
-
Fiscal Year
-
Fiscal Period
-
Budget
-
Segment 02 (Department)
-
Segment 03 (Location)
-
Segment 04
-
Segment 05
-
Segment 06
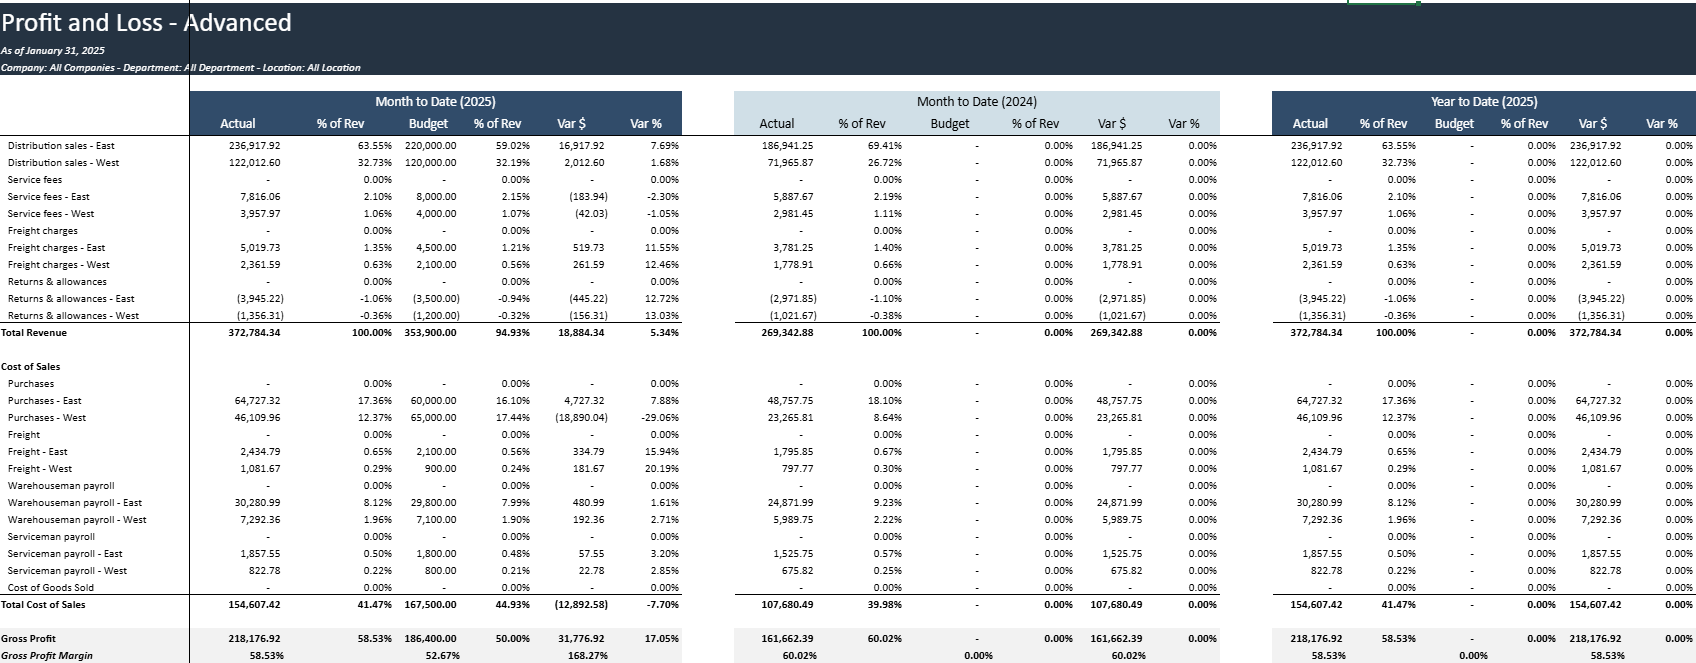
Profit and Loss - Advanced
Advanced Profit and Loss Statement with more advanced KPIS, such as % of Revenues, Budget, and Variances for the current and past year.
Key metrics at a glance:
-
Actual: This column shows the actual financial performance (GL Posting Amount) of each P&L account for the period being analyzed.
-
% of Rev (Actual): This column shows the percentage of total revenue of each P&L account. It is calculated as (Actual / Total Revenues) * 100.
-
Budget: This column shows the budgeted financial performance (Budget Posting Amount) of each P&L account for the period.
-
% of Rev (Budget): This column shows the percentage of total revenue of each P&L account. It is calculated as (Budget / Total Revenues) * 100.
-
Var $: This column shows the dollar value variance between the actual and budgeted performance of each P&L account .
-
Var %: This column shows the percentage variance between the actual and budgeted performance of each P&L account . It is calculated as (Var $ / Budget) * 100.
Mapping and Filtering
Mapping
All the reports in the Profit & Loss section have the same report structure that can be customized based on the Account Grouping of Sage 100.
The following mapping needs to be changed accordingly in the "Mapping" Sheet of each report. Note that the account mapping to each Reporting Code is defined in the Reporting Code configuration worksheet, as described here.
| Report Section | Reporting Code |
| Revenue | 400 |
| Cost of Sales | 450 |
| Operating Expenses - Central | 500 |
| Operating Expenses | 600 |
| General & Administrative | 700 |
| Other Income & Expense | 950 |
| Provision for Income Taxes | 990 |
Selection Page
The selection page offers the following fields:
-
Company
-
Fiscal Year
-
Fiscal Period
-
Budget
-
Segment 02 (Department)
-
Segment 03 (Location)
-
Segment 04
-
Segment 05
-
Segment 06
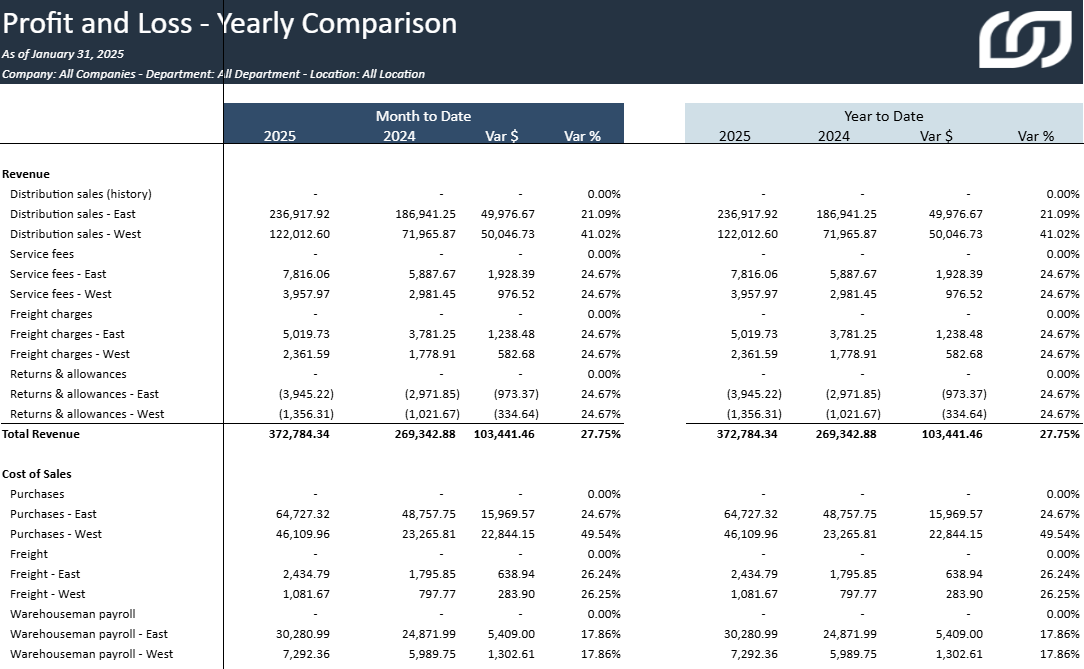
Profit and Loss - Yearly Comparison
Profit and Loss Statement with a current month section and a year to date section that compares current and past year.
Key metrics at a glance:
-
Current Year: This column shows the actual financial performance (GL Posting Amount) of each P&L account for the current period.
-
Last Year: This column shows the actual financial performance (GL Posting Amount) of each P&L account for last year's same period.
-
%: This column shows the variance in percentage from the current period compared to last year's same period. It is calculated as (Current Year Period - Last Year Period / Current Year Period) * 100.
Mapping & Filtering
Mapping
All the reports in the Profit & Loss section have the same report structure that can be customized based on the Account Grouping of Sage 100.
The following mapping needs to be changed accordingly in the "Mapping" Sheet of each report. Note that the account mapping to each Reporting Code is defined in the Reporting Code configuration worksheet, as described here.
| Report Section | Reporting Code |
| Revenue | 400 |
| Cost of Sales | 450 |
| Operating Expenses - Central | 500 |
| Operating Expenses | 600 |
| General & Administrative | 700 |
| Other Income & Expense | 950 |
| Provision for Income Taxes | 990 |
Selection Page
The selection page offers the following fields:
-
Company
-
Fiscal Year
-
Fiscal Period
-
Budget
-
Segment 02 (Department)
-
Segment 03 (Location)
-
Segment 04
-
Segment 05
-
Segment 06
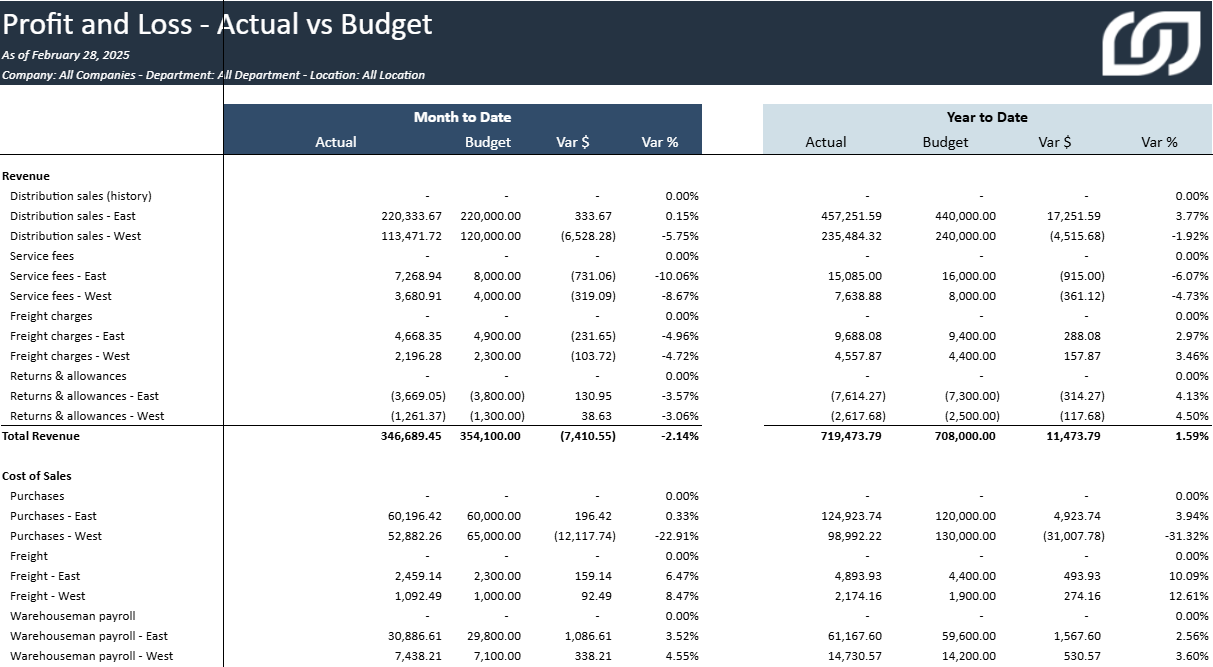
Profit and Loss - Actual vs. Budget
Profit and Loss Statement with a month to date section and a year to date section that compares Actual vs Budget.
Key metrics at a glance:
-
Actual: This column shows the actual financial performance (GL Posting Amount) of each P&L account for the period being analyzed.
-
Budget: This column shows the budgeted financial performance (Budget Posting Amount) of each P&L account for the period.
-
%: This column shows the variance in percentage for the actual vs budget. It is calculated as (Actual / Budget) * 100.
Mapping & Filtering
Mapping
All the reports in the Profit & Loss section have the same report structure that can be customized based on the Account Grouping of Sage 100.
The following mapping needs to be changed accordingly in the "Mapping" Sheet of each report. Note that the account mapping to each Reporting Code is defined in the Reporting Code configuration worksheet, as described here.
| Report Section | Reporting Code |
| Revenue | 400 |
| Cost of Sales | 450 |
| Operating Expenses - Central | 500 |
| Operating Expenses | 600 |
| General & Administrative | 700 |
| Other Income & Expense | 950 |
| Provision for Income Taxes | 990 |
Selection Page
The selection page offers the following fields:
-
Company
-
Fiscal Year
-
Fiscal Period
-
Budget
-
Segment 02 (Department)
-
Segment 03 (Location)
-
Segment 04
-
Segment 05
-
Segment 06
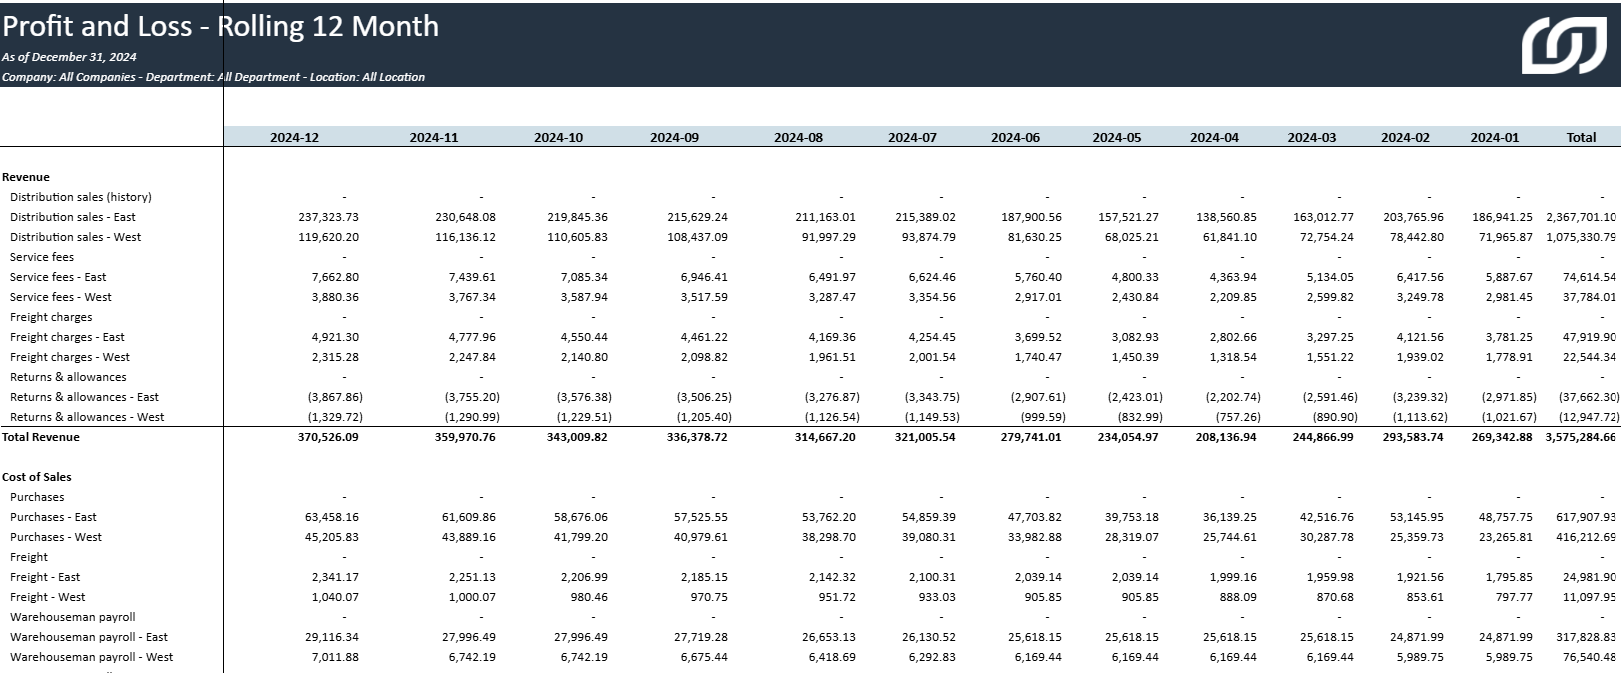
Profit and Loss - Rolling 12 Month
Profit and Loss Statement for the last 12 months (from the selected period) showcasing the financial performance (Ledger Posting) of each P&L account, also known as Trailing 12 months (TTM).
Key metrics at a glance:
-
YYYYMM: This column shows the Gl Posting Amount of each P&L account for the period.
Mapping & Filtering
Mapping
All the reports in the Profit & Loss section have the same report structure that can be customized based on the Account Grouping of Sage 100.
The following mapping needs to be changed accordingly in the "Mapping" Sheet of each report. Note that the account mapping to each Reporting Code is defined in the Reporting Code configuration worksheet, as described here.
| Report Section | Reporting Code |
| Revenue | 400 |
| Cost of Sales | 450 |
| Operating Expenses - Central | 500 |
| Operating Expenses | 600 |
| General & Administrative | 700 |
| Other Income & Expense | 950 |
| Provision for Income Taxes | 990 |
Selection Page
The selection page offers the following fields:
-
Company
-
Fiscal Year
-
Fiscal Period
-
Budget
-
Segment 02 (Department)
-
Segment 03 (Location)
-
Segment 04
-
Segment 05
-
Segment 06
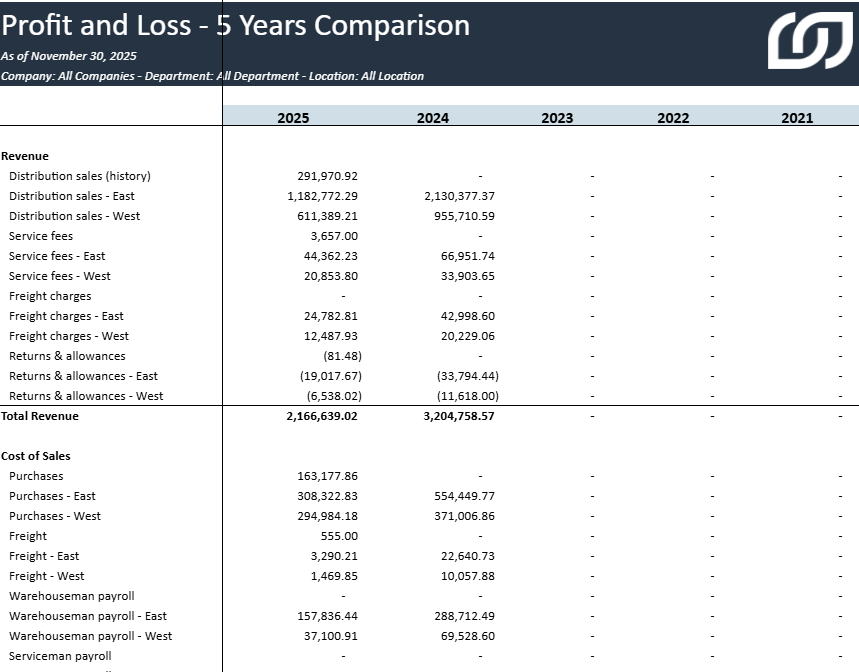
Profit and Loss - 5 Years Comparison
Profit and Loss Statement for the last 5 years from the selection.
Key metrics at a glance:
-
Year: This column shows the GL Posting Amount of each P&L account for the period.
Mapping & Filtering
Mapping
All the reports in the Profit and Loss section have the same report structure that can be customized based on the Account Grouping of Sage 100.
The following mapping needs to be changed accordingly in the "Mapping" Sheet of each report. Note that the account mapping to each Reporting Code is defined in the Reporting Code configuration worksheet, as described here.
| Report Section | Reporting Code |
| Revenue | 400 |
| Cost of Sales | 450 |
| Operating Expenses - Central | 500 |
| Operating Expenses | 600 |
| General & Administrative | 700 |
| Other Income & Expense | 950 |
| Provision for Income Taxes | 990 |
Selection Page
The selection page offers the following fields:
-
Company
-
Fiscal Year
-
Fiscal Period
-
Budget
-
Segment 02 (Department)
-
Segment 03 (Location)
-
Segment 04
-
Segment 05
-
Segment 06
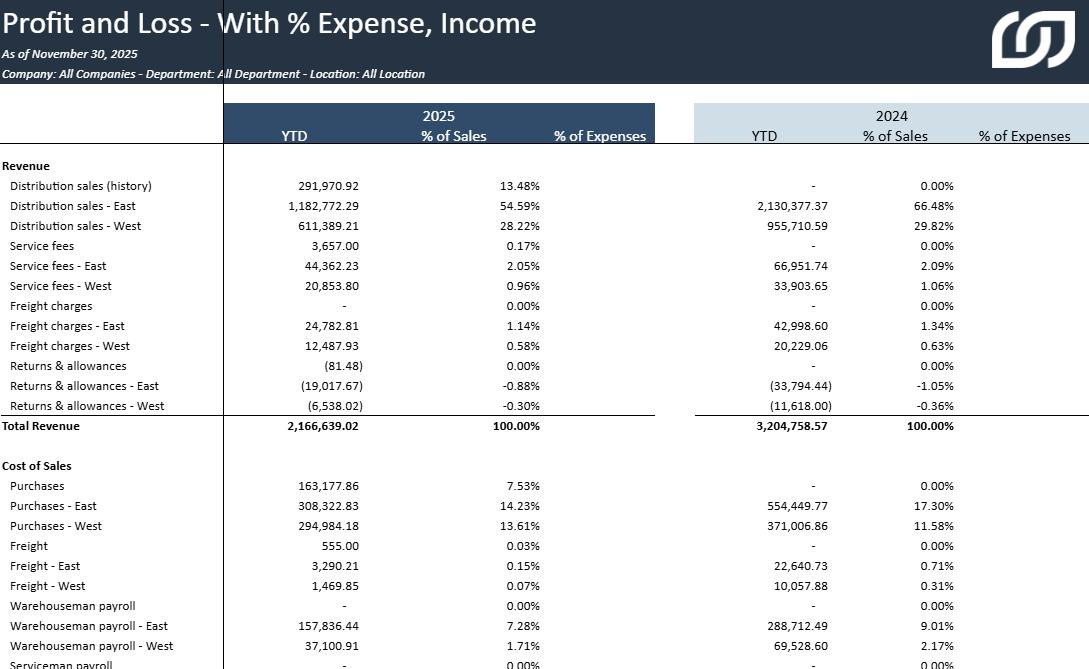
Profit and Loss - With % Expense, Income
Profit and Loss Statement that includes a year to date, % of sales and % of expenses for the selected period and the previous year's selected period.
Key metrics at a glance:
-
Year to Date (YTD): This column shows the financial performance (GL Posting Amount) for the entire year up to the end of the current month.
-
% of Sales: This column shows the percentage of total revenue that each P&L account represents. It is calculated as (YTD / Total Sales) * 100.
-
% of Expenses: This column shows the percentage of total expenses that each P&L account represents. It is calculated as (YTD / Total Expenses) * 100.
Mapping & Filtering
Mapping
All the reports in the Profit and Loss section have the same report structure that can be customized based on the Account Grouping of Sage 100.
The following mapping needs to be changed accordingly in the "Mapping" Sheet of each report. Note that the account mapping to each Reporting Code is defined in the Reporting Code configuration worksheet, as described here.
| Report Section | Reporting Code |
| Revenue | 400 |
| Cost of Sales | 450 |
| Operating Expenses - Central | 500 |
| Operating Expenses | 600 |
| General & Administrative | 700 |
| Other Income & Expense | 950 |
| Provision for Income Taxes | 990 |
Selection Page
The selection page offers the following fields:
-
Company
-
Fiscal Year
-
Fiscal Period
-
Budget
-
Segment 02 (Department)
-
Segment 03 (Location)
-
Segment 04
-
Segment 05
-
Segment 06