NFP CFO Dashboard
The CFO Dashboard provides a real-time snapshot of an organization's financial health. It includes both a financial performance overview and a detailed financial analysis, equipping a non-profit with important financial insights that can help improve sustainable growth and impact.
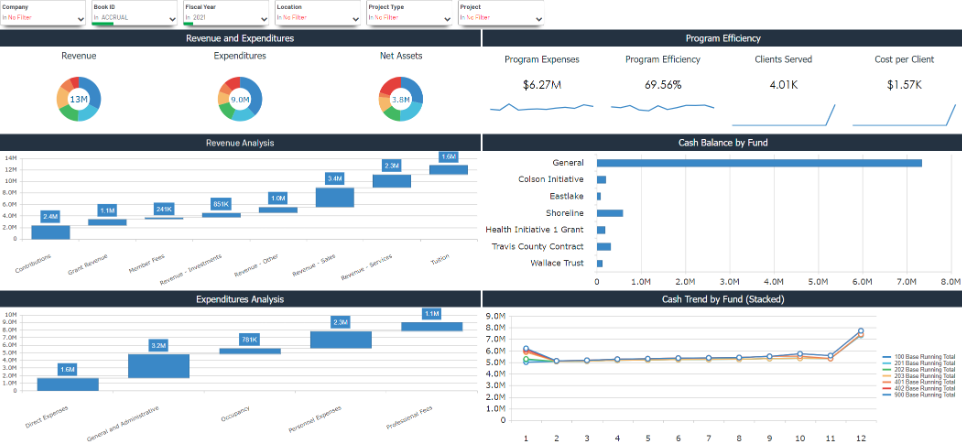
Key metrics at a glance:
Financial Performance Overview:
-
Revenue and Expenditures: This section tracks metrics such as total revenue, program expenses, and net assets. This can help CFOs understand the financial health of the program and identify areas where spending can be optimized.
-
Revenue Analysis: This section provides a breakdown of revenue by funding source (e.g., grants, contracts). This can help CFOs understand where their funding is coming from and how it is being used.
-
Program Efficiency: This metric compares program expenses to the number of clients served. A lower program efficiency number indicates that the program is serving more clients for each dollar spent. In the image, it shows that the program efficiency is 100.00%, possibly indicating low program expenses or a very small number of clients served.
-
Clients Served: This metric tracks the total number of clients served by the program. This is a key metric for understanding the program's reach and impact.
-
Cost per Client: This metric is calculated by dividing program expenses by the number of clients served. It gives an indication of the average cost of serving each client.
-
Expenditures Analysis: This section provides a breakdown of program expenses by category (e.g., personnel costs, supplies). This can help CFOs identify areas where they can cut costs.
Benefits of this dashboard:
-
Improve program efficiency by identifying ways to serve more clients with the same amount of funding.
-
Optimize program costs by identifying areas where spending can be reduced.
-
Track program impact by monitoring the number of clients served and the cost per client.
-
Make data-driven decisions about program resource allocation and service delivery.
Filtering
You can filter the dashboards using these filtering panels:
-
Company (Tenant)
-
Fiscal Year
-
Book ID
-
Location (Funds)
-
Project Type
-
Project