NFP Revenue and Expenditure Report
A Revenue and Expenditure Report, also called a Statement of Activities, is a useful tool for non-profit organizations that provides accountability, transparency, and financial performance tracking. It also helps with decision making, attracting donors, and grant applications and reporting.
Benefits of this report:
-
Accountability and transparency: Shows donors, volunteers, and grants where money is going, building trust and showing an organization's commitment to their mission.
-
Financial Performance Tracking: Allows non-profits to track their financial health and identify areas for improvement.
-
Decision Making: Helps the non-profit make informed decisions about resource allocation by showing analysis of revenue sources and spending patterns.
-
Grant Applications and Reporting: Demonstrates an organization's financial stability and ability to manage funds, making their grant applications more competitive when providing financial information.
-
Attracting Donors: Provides detailed and effective financial statements that inspire confidence in donors
| On This Page |
Mapping & Filtering
All reports in the Revenues and Expenditures section have the same report structure that can be customized based on the Account Grouping of Sage Intacct.
Mapping
The following mapping can be changed accordingly in the Mapping Sheet of each report.
| Report Section | Account Group |
| Grant Revenue | 1424 |
| Contributions | 1426 |
| Tuition | 1547 |
| Member Fees | 1427 |
| Sales | 1281 |
| Service Fees | 1288 |
| Investment Earnings | 1495 |
| Other Revenue | 1897 |
| Personnel Expenses | 1494 |
| Professional Fees | 1381 |
| Program Expenses | 1435 |
| Occupancy | 1433 |
| General and Administrative Expenses | 1201 |
Filtering
All reports in the Revenues and Expenditures section share the same selection page with the same filtering capabilities.
-
Company (Tenant ID)
-
Year
-
Month
-
Parent Fund
-
Budget (for some reports only)
-
Fund
-
Book
-
Department
-
Projects
Revenues & Expenditures
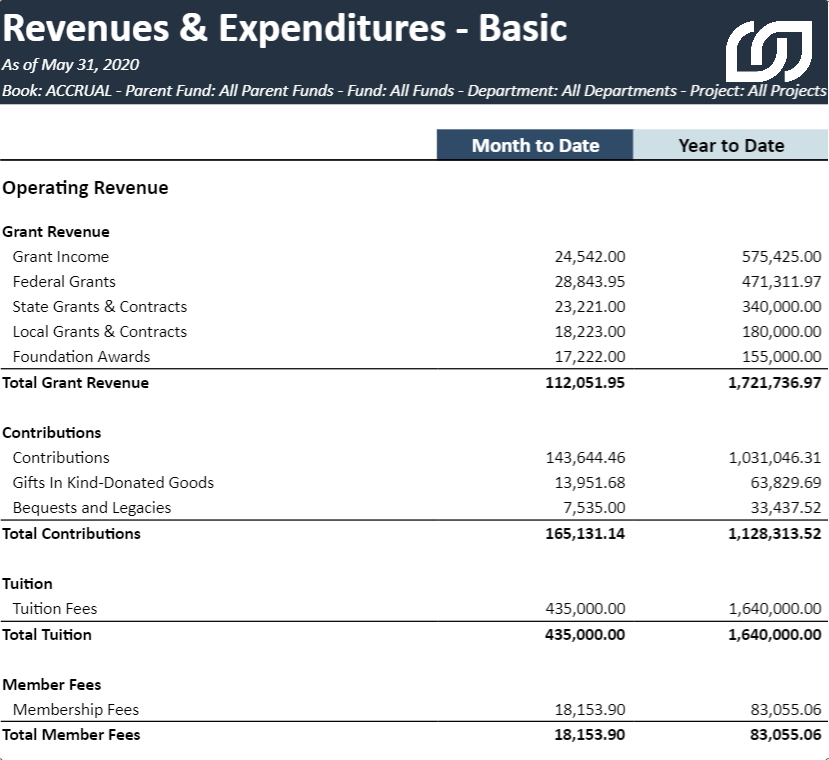
Basic
The basic version of the Revenue and Expenditure Report includes the Month to Date and Year to Date columns only. It is used to provide and quick and simple snapshot of revenues and expenditures.
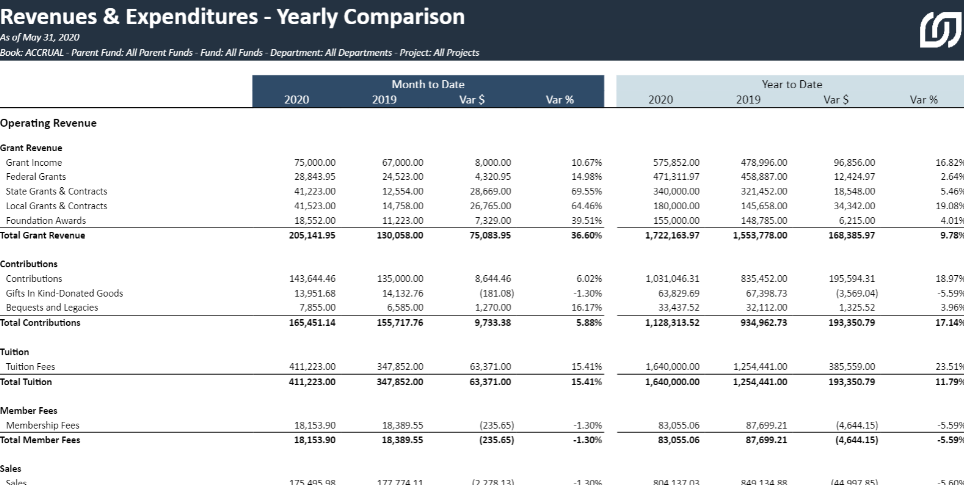
Yearly Comparison
The Yearly Comparison version of the Revenue and Expenditure Report provides a comparison between two years, with the variance provided in currency and percentage format. It is a quick way to view the evolution of the organization over two years.
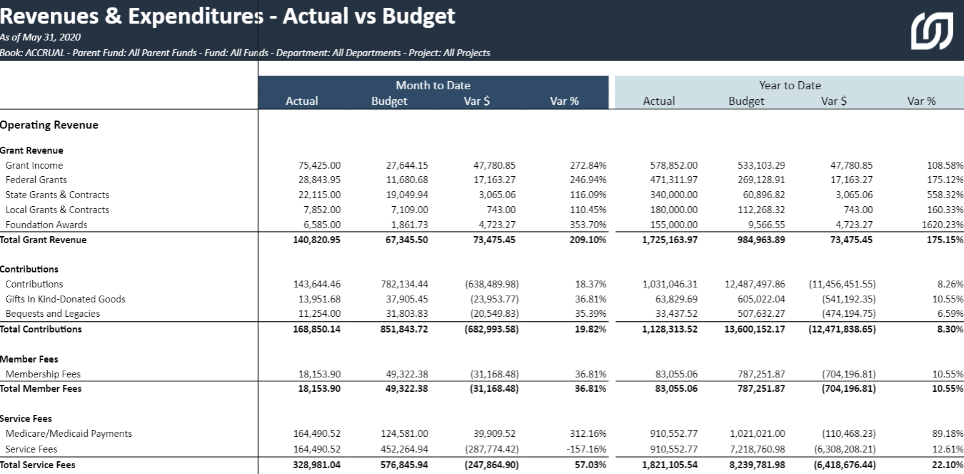
Actual vs. Budget
The Actual vs. Budget version of the report compares the monthly and yearly budget of the organization to what was actually spent, providing a way to see if the budget was respected.
Forecast
The Revenues & Expenditures Forecast Report provides a picture of the predicted revenues and expenditures up to the end of the year. The month entered in the Selection page is used as the cut-off for the report. Anything before this month contains actual data, while the remaining months are based on the budget data.