Calculated Columns and Calculated Pivots
Users have the option to create their own custom measures and use them in views. User Calculated Pivots are very similar; instead of having a list of all the fields in the data model, a distinct list is viewed for the Measure columns.
After defining a user calculated measure, it can be used in any view belonging to the data model, by any user who has access to the data model, provided that they also have access to the fields defined in the measure.
User Calculated Pivots can only be used in the view where the data is pivoted the same way.
To create a measure:
- In the Settings menu (right panel), click on
and select Calculated Column.
-
Click Add.
-
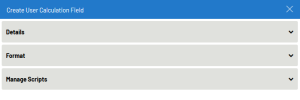
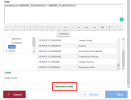
The Create User Calculation Field wizard opens. Enter the parameters as described below.
NoteIf the active view includes pivots the user can also select the option Calculated Pivot. Either option will open the Create User Calculation Field wizard where the properties can be defined.
-
Once you are done, click Validate to get the confirmation that the expression is valid.
-
Click Save.
| Setting | Description |
|---|---|
| Details | |
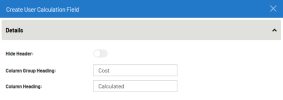
| Hide Header |
Drag the slider to hide the header of the column. Tip
If a calculated column has the Hide Header option enabled, no content can be used as a spacer. |
| Column Group Heading | Enter the name of the desired title for the Column Group Heading. |
| Column Heading | To determine the headings that will be displayed for this new field. |
| Format | |
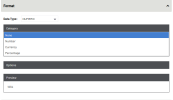
| Data Type | To determine whether the field is Numeric, Character, Date, etc. |
| Format |
To manage how the data will be displayed within this field and the option in the Format window will be based on the data type:
|
| Manage Scripts |
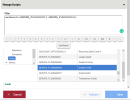
This option will take the user to an Expression Builder Wizard that will help create a Javascript to calculate the value of the user-defined measure. This is a more advanced option. Please ask an IT Administrator for assistance. The wizard provides a list of all the fields available in the data model (under Fields) and a variety of functions, statements, operators and constants to help with the script creation. Clicking a field name or a specific function or statement will insert them in the Script where the cursor is currently placed. The Javascript created in the wizard must start with necResult= and finish with a semi-colon ; for it to
be valid.
|
Use global variables within the calculated pivots to make them more dynamic.
The calculation: (2019-Margin)/(2019-Margin)-(2018-Margin)
Can be changed to: (@@THISYEAR-Margin)/( @@THISYEAR -Margin)-( @@LASTYEAR-Margin)
