Sales Forecast
To properly analyze a company's sales, you need to compare its actual sales with the sales objectives that have been set. The Sales Forecast module was created to help you perform this task more easily.
Forecast Configuration
You first need to create a Forecast Configuration before being able to create a sales forecast. This configuration allows you to determine the level of detail you want to apply to the forecasts you generate.
To do so:
- In the Data Models and Views tab, expand the Universal Data Model and the Sales folders.
- Expand the Forecast Data Entry and Forecast Configs folders.
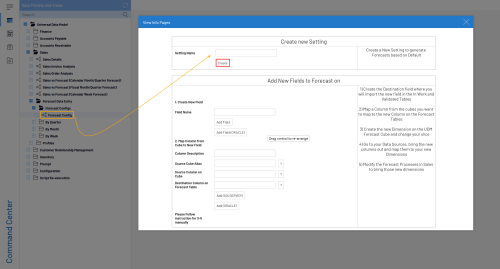
- Right-click on the Forecast Config data model and select View Info Pages.
- Under the Create New Setting section, in the Setting Name field, enter a configuration code to identify the Forecast you create.
- Click on Create to finish.
By default, all levels of detail are selected. This level of detail is defined according to the number of Dimensions available in the Sales module.
We recommend reducing the level of detail, as it makes generating a sales forecast less complicated.
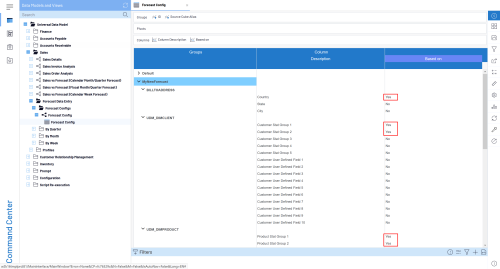
To set the level of detail, expand the Forecast Config data model and open the Forecast Config view.
Let's use a forecast named MyNewForecast based on the steps in Forecast Configuration. We set the level of detail by only keeping the Country, some Customer Stat Group and Product Stat Group.
Level of detail in the Time dimension is addressed in the next section.
Creating the Forecast
You can create sales forecasts using three levels of detail for the time period: per week, month or quarter.
To do so:
- In the Data Models and Views tab, expand the Universal Data Model and the Sales folders.
- Expand the Forecast Data Entry and Forecast Configs folders.
- Expand the folder for the time period for which you want to generate a sales forecast.
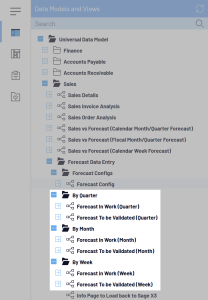
- Right-click on the Forecast data model you want to use and select View Info Pages.
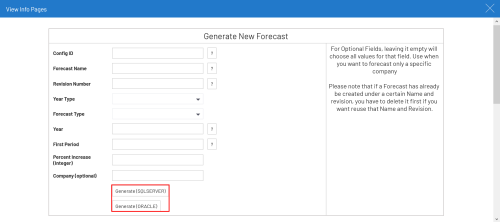
- Under the Generate New Setting section:
- In the Config ID field, click on the Prompt icon (the question mark) to select the Setting Name you defined in Forecast Configuration.
- In the Forecast Name field, enter a name for the forecast that will refer to the first period (ex: FRCST202001 for a forecast starting from the first of January 2020 to the 31st of December 2020).
- In the Revision Number field, enter 1, which should be the default value since forecasts are generated incrementally.
- In the Year Type drop-down list, select whether you want to generate forecasts by fiscal year or calendar year.
- In the Forecast Type drop-down list, select whether you want to generate forecasts by amount (i.e. sales in $ regardless the quantity) or quantity (i.e. units sold).
- In the Year field, enter the year from which the forecast should start.
- In the First Period field, enter the period (fiscal or calendar) from which the forecast should start.
- In the Percent Increase field, enter the increase or decrease percentage from last year to be applied to future forecasts.
- In the Company field, specify the Company that will be impacted by these forecasts.
- Click on Generate depending your server to finish.
Use case: Adding a Dimension to the Forecast
The Dimensions you would like to use may not be available in the default version, and this is explained in Forecast Configuration.
To add a Dimension to the forecast, you need first to retrieve the Dimension from the source cube you want to use then add a Dimension to the Forecast cube to finally perform a mapping between the Fields of these Dimensions.
In this example, we will add the UDFIELD001 field as a Dimension by retrieving it from the User Defined Field group dimension in the UDM DimProduct cube.
Retrieving the Dimension from the Source Cube
- In the Administration section
, click on
OLAP Manager in the left pane.
- In the list, select the UDM DimProduct cube.
- Untick the Production checkbox and click on Save.
- In the Navigation Bar, click on the
Navigation drop-down list and select
Dimensions.
- Click on the little arrow next to the User Defined Field group dimension to reveal its Dimensions.

- Make note of the Field Name and name of its Cube as you will need them to set up the addition of this Dimension to your Forecast Configuration.
Now that we know which information to retrieve, we need to add this field to the Forecast cube.
- In the Navigation Bar, click on
to go back to the Cubes list.
- Tick the Production checkbox and click on Save.
- Back to the Data Models and Views tab, right-click on the Forecast Config data model and select View Info Page (refer to Forecast Configuration if you forgot the path).
- Under the Add New Fields To Forecast section:
- In the Field Name field, enter the field name of the Dimension you will add to the Forecast cube and click on Add Field depending on your server (SQL or Oracle).
- In the Column Description field, enter a description preferably related to the name of the field.
- In the Source Cube Alias and Source Column on Cube fields, click on the Prompt icon (the question mark) to select the cube and the column (i.e. Field Name) from which you want to retrieve data.
- In the Destination Column on Forecast Table field, enter the same name defined in the Field Name field to facilitate the mapping.
- Click on Add depending on your server (SQL or Oracle).
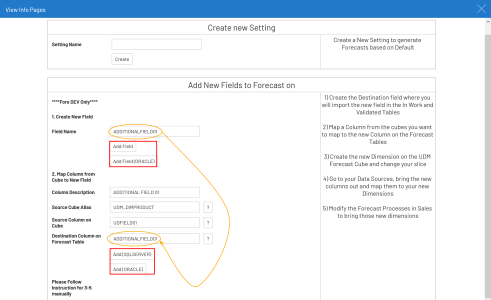
Now that we have created the Field from the Source Cube (i.e. UDM DimProduct), in order to add it to the Destination Cube (i.e. UDM Forecast) we need to create a dimension in this cube.
Adding a Dimension to the Forecast Cube
- Back to OLAP Manager, select the UDM Forecast cube.
- Untick the Production checkbox and click on Save.
- In the Navigation Bar, click on the
Navigation drop-down list and select
Dimensions.
- Follow the steps described in Create a Dimension to add a Dimension to the Group Dimension you are interested in.
Now we have updated the UDM Forecast cube, we can proceed to the mapping of the fields so that the information be retrieved and displayed in the Views located under each Time Period folder (By Quarter, By Month, By Week)
Mapping the Fields
- In the Navigation Bar, click on the
Navigation drop-down list and select
Data Sources.
- Select the data source you want to modify according to the Time Period you want to use.
- In the Navigation Bar, click on
Data Sources and select
Edit Data Source.
- Expand the Fact Table and look for the Dimension you created in Adding a Dimension to the Forecast Cube.
- Right-click on the Field (ADDITIONALFIELD01 in this case) and select Add as Dimension OR click on the checkbox representing the Dimension icon (
).

The Field is added to the Calculated Fields list and will already be selected.
- In the Navigation Bar, click on
Data Sources and select
Dimension Mappings.
- In the pop-up window, click on Save and Exit.
- In the Dimension Mappings window, map the Cube Dimension with the Data Source Field (Additional Field 01 with ADDITIONNALFIELD01 in this case).

- Once done, click on the Save icon to keep your changes.

- In the Navigation Bar, click on
to go back to the Data Sources list.
- Click one more time on
to go back to the Cubes list.
- Tick the Production checkbox and click on Save.
- Follow the steps described in Build to build the UDM Forecast cube.
Adding the Field in the Data Model Designer
- Back to the Data Models and Views tab, expand the Universal Data Model and the Sales folders.
- Expand the Forecast Data Entry and Forecast Configs folders.
- Expand the folder for the time period for which you want to generate a sales forecast, right-click on its Data Model and select Design Data Model.

- Expand the Fact Table and look for the Field you created.
- Double-click on it to add it to the Data Model.
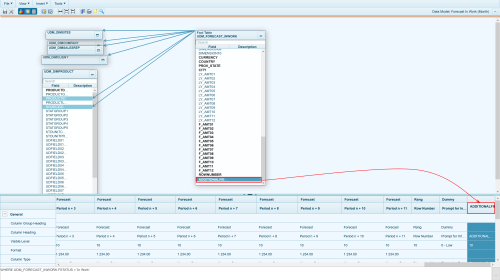
- Refer to Column Properties to set this new column according to your preferences.
- Once done, in the upper left-hand corner, click on File and select Save Data Model.
- Back to the Data Models and Views tab, expand the Universal Data Model and the Sales folders.
- Expand the Forecast Data Entry and Forecast Configs folders.
- Expand the folder for the time period for which you want to get a sales forecast and open the view.

