Sales Forecast Workflow
To properly analyze a company's sales, you need to compare its actual sales with its set sales objectives. The Sales Forecast module was created to help you perform this task more easily.
Configuring the Forecast
You first need to create a Forecast Configuration before being able to create a sales forecast. This configuration allows you to determine the level of detail you want to apply to the forecast.
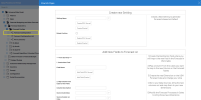
- In the Data Models and Views tab, expand the Universal Data Model and Financial Budgeting and Sales Forecast folders.
- Expand the Forecast Data Entry and Forecast Configs folders.
- Right-click the Forecast Configuration data model and select View Info Pages.
- Under the Create New Setting section, in the Setting Name field, enter a configuration code to identify the forecast.
-
Click Create to finish.
By default, all levels of detail are selected. This level of detail is defined according to the number of dimensions available in the Sales module.
We recommend reducing the level of detail, as it makes generating a sales forecast less complicated.
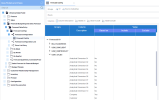
To set the level of detail, expand the Forecast Config data model and open the Forecast Config view.
Let's use a forecast named MyNewForecast based on the steps in Configuring the Forecast. We set the level of detail by only keeping the Country, some Customer Stat Group and Product Stat Group.
Level of detail in the Time dimension is addressed in the next section.
Creating the Forecast
You can create sales forecasts using three levels of detail for the time period: per week, month or quarter.
- In the Data Models and Views tab, expand the Universal Data Model and the Financial Budgeting and Sales Forecast folders.
-
Expand the Forecast Data Entry for the time period for which you want to generate the sales forecast.
- Right-click the Forecast data model you want to use and select View Info Pages.
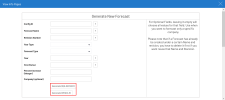
- Under the Generate New Setting section:
- In the Config ID field, click on the Prompt icon
 to select the Setting Name you defined in Configuring the Forecast.
 - In the Forecast Name field, enter a name for the forecast that will refer to the first period (ex: FRCST202001 for a forecast starting from the first of January 2020 to the 31st of December 2020).
- In the Revision Number field, enter 1, which should be the default value since forecasts are generated incrementally.
- In the Year Type drop-down list, select whether you want to generate forecasts by fiscal year or calendar year.
- In the Forecast Type drop-down list, select whether you want to generate forecasts by amount (i.e. sales in $ regardless the quantity) or quantity (i.e. units sold).
- In the Year field, enter the year from which the forecast should start.
- In the First Period field, enter the period (fiscal or calendar) from which the forecast should start.
- In the Percent Increase field, enter the increase or decrease percentage from last year to be applied to future forecasts.
- In the Company field, specify the Company that will be impacted by these forecasts.
- In the Config ID field, click on the Prompt icon
-
Click Generate depending your server to finish.
Forecast Methods
There are 5 different methods from which you can choose to generate a single forecast. Please note that all of the forecast methods generate data based on your Last Year values.
The forecast methods are:
-
Last Year % Increase — Generates a forecast of the per cent increase of sales over the last 12 months.
-
0 Forecast — Retrieves all products sold over the last 12 months and resets their value to 0.
-
Linear Regression — Generates a forecast prediction for the next 12 months based on the dataset provided by the parameters. The more years there are, the more precise the forecast will be. Using linear regression for seasonal products is not advisable because of the fluctuations.
-
Average of Last Year With an Increase — Generates a forecast of the per cent increase of sales over the last 12 months after evenly dividing the sales by 12.
-
Forecast of N Months Based on the Average of M Months With a Constant Growth of X — Generates a forecast where each period is multiplied by the specified Growth value.
If T represents the average sales over the last N months, and the Growth value is X, then:
1st Period = T * (1 + X/100)
2nd Period = 1st Period * (1 + X/100) = T * (1 + X/100) * (1 + X/100)
and so on.
When using the Linear Regression forecast method, please make sure that you turn off all dimensions in your Forecast Configuration. Otherwise, the forecast may generate incorrect data.
Dimension covariance is not compatible with any forecast generation method and could falsify forecast results. In addition, seasonality is not taken into consideration for forecasts.
Reviewing the Forecast
Once you have generated a forecast, you need to review the forecast data. The data produced by all forecast generation methods are only rough estimates that are intended to be revised by the user.
To edit your forecast:
-
Open the Forecast In Work worksheet of the period type you selected.
-
Edit the values as you deem fit.
-
Please make sure that the Auto-Save feature is disabled so that you do not unintentionally overwrite your data. When you want to save manually, simply click Save Data.
The Split by Ratio feature is enabled by default for each column. That means that if you perform a group-level change, the new group total will be redistributed across all rows to reflect the same per cent value that each row represented of the previous group total.
Example: You have 4 rows—10, 20, 30 and 40 (a group total of 100). If you were to change your group total to 200, the 4 rows would automatically become 20, 40, 60 and 80 respectively (i.e., 10/100 * 200 = 20).
To disable the Split by Ratio feature, select Design Data Model and remove the column in Edit > Split by Ratio.
For more information, see Edit and Refresh Data.
Sending the Forecast for Evaluation
-
Once you have reviewed your forecast data, you can send the forecast for evaluation. Right-click the Forecast in Progress data model and select View Info Pages.
-
Use the Send for Evaluation or Delete info page to send your forecast to another user for evaluation.
-
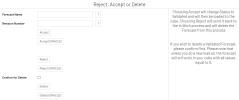
The forecast is then moved to the Forecast To be Validated (Period) data model from which the reviewer can evaluate the data. Once finished, the reviewer can use the info page to Accept, Reject, or Delete the forecast. If rejected, the forecast will be sent back to the Forecast In Work (Period) data model.
Even if a forecast has been validated, it can still be rejected through the Reject, Accept or Delete info page.
Once validated, forecasts can no longer be edited unless they are rejected by a reviewer. Until then, if minor adjustments are necessary, you can make them via the Forecast to be Evaluated (Period) worksheet. However, please note that a higher level of security is applied to that worksheet (30 by default).
Refreshing the Forecast Cube
Once a forecast has been validated, you must refresh the #3 UDM Forecast Cube (or execute a Load All operation). You will then be able to compare the forecast data with your current data models and dashboards.
When using Oracle, you must disable the SQL Server data source and enable the Oracle data source.
The UDM_GENERATE_VIEW stored procedure in the Oracle data source allows you to recreate the UDM_SALES_GROUP, UDM_FORECAST_UNPIV and UDM_WEEKFORECAST_UNPIV views to check their formatting before refreshing the cube or executing a Load All operation.
The UDM_GENERATE_VIEW stored procedure will include all dimensions set to Yes across all of your Forecast Configurations at the time of the operation. For that reason, you may wish to change the default Forecast Configuration value to No for dimensions that you will likely not use.


