Groups
Data can be grouped using the Groups section for one or several columns.
- For instance, drag the
dimension from the folder you are interested in to place it into the Groups section.
 Tip
TipThe same operation can be achieved by clicking on
 and selecting Groups and then Add.
Example
and selecting Groups and then Add.
ExampleHere the worksheet is grouped by Year, Customer Code, Product Code and Document Number:

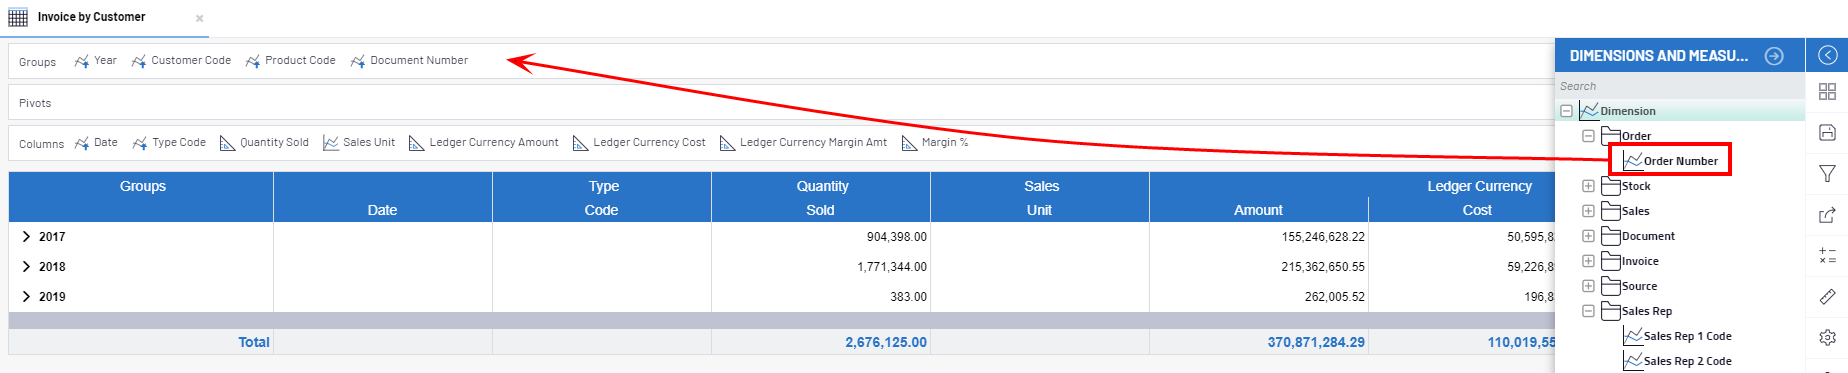

Once grouped, a summary row is added for each value of each dimension in the grouping section. All grouped rows include summary values of specific columns (i.e. totals of Dollar, Margin and Cost).
Grouping is not available for all columns, rather, only for those that have been configured within the data model definition as dimensions.
If a worksheet is grouped by multiple columns, the grouping is based on the order in which related columns appear in the Groups section, beginning from left to right.
In order to group a worksheet by Customer Code and then by Year, the Customer Code needs to be moved to the column header in the Groups section before the Year column:

To ungroup data for a specific column move the column name from the Groups section back to the column header area.
Refer to Expand / Drill Down for more details about showing and hiding grouped data.