Production Execution & Bottlenecks
The Production Execution & Bottlenecks dashboard provides visibility into the status, performance, and risk profile of active production orders. It covers execution progress, work center efficiency, cost performance, and schedule adherence in one place, so operations teams can monitor what is happening on the shop floor and act before issues escalate. Use this dashboard to support proactive production management, identify bottlenecks early, and keep orders on track for on-time delivery.
When reviewing this dashboard, keep in mind that at-risk orders still in Planned status typically indicate a scheduling or release issue rather than an execution problem. A negative Total Cost Variance may look favorable early on, but costs accumulate as production progresses and should be monitored over time. When investigating specific bottlenecks, the Production Execution Details worksheet is the right starting point.
Benefits of this dashboard
- Monitor active production orders with a consolidated view of execution status and operational progress.
- Detect at-risk and overdue orders before they lead to missed deliveries.
- Analyze work center performance, labor utilization, and completion trends.
- Track cost variance early to support corrective action before overruns grow.
- Focus on critical orders and bottlenecks using priority-driven views of the production pipeline.
Key performance indicators (KPIs)
Key performance indicators (KPIs) are displayed at the top of the dashboard. They give you an at-a-glance summary of the current production situation and update based on the filters you apply.
| KPI | Description |
|---|---|
| Active Production Orders | Total number of production orders currently in Planned or In process status. Reflects the current execution workload. |
| At-Risk Orders | Count of active production orders flagged for schedule delays, cost overruns, or execution issues. An early warning indicator before orders become overdue. |
| Overdue Orders | Number of active production orders with due dates earlier than today. Signals delivery risk that requires immediate attention. |
| On-Time % | Percentage of active production orders that are not overdue. A core indicator of overall schedule adherence. |
| Total Cost Variance | Difference between planned and actual production costs across active operations. Negative values reflect favorable cost performance. |
| Average Operation Completion % | Average completion percentage across active production operations. Tracks execution progress at the operation level, not just the order level. |
Visual components
| View | Type | What it shows |
|---|---|---|
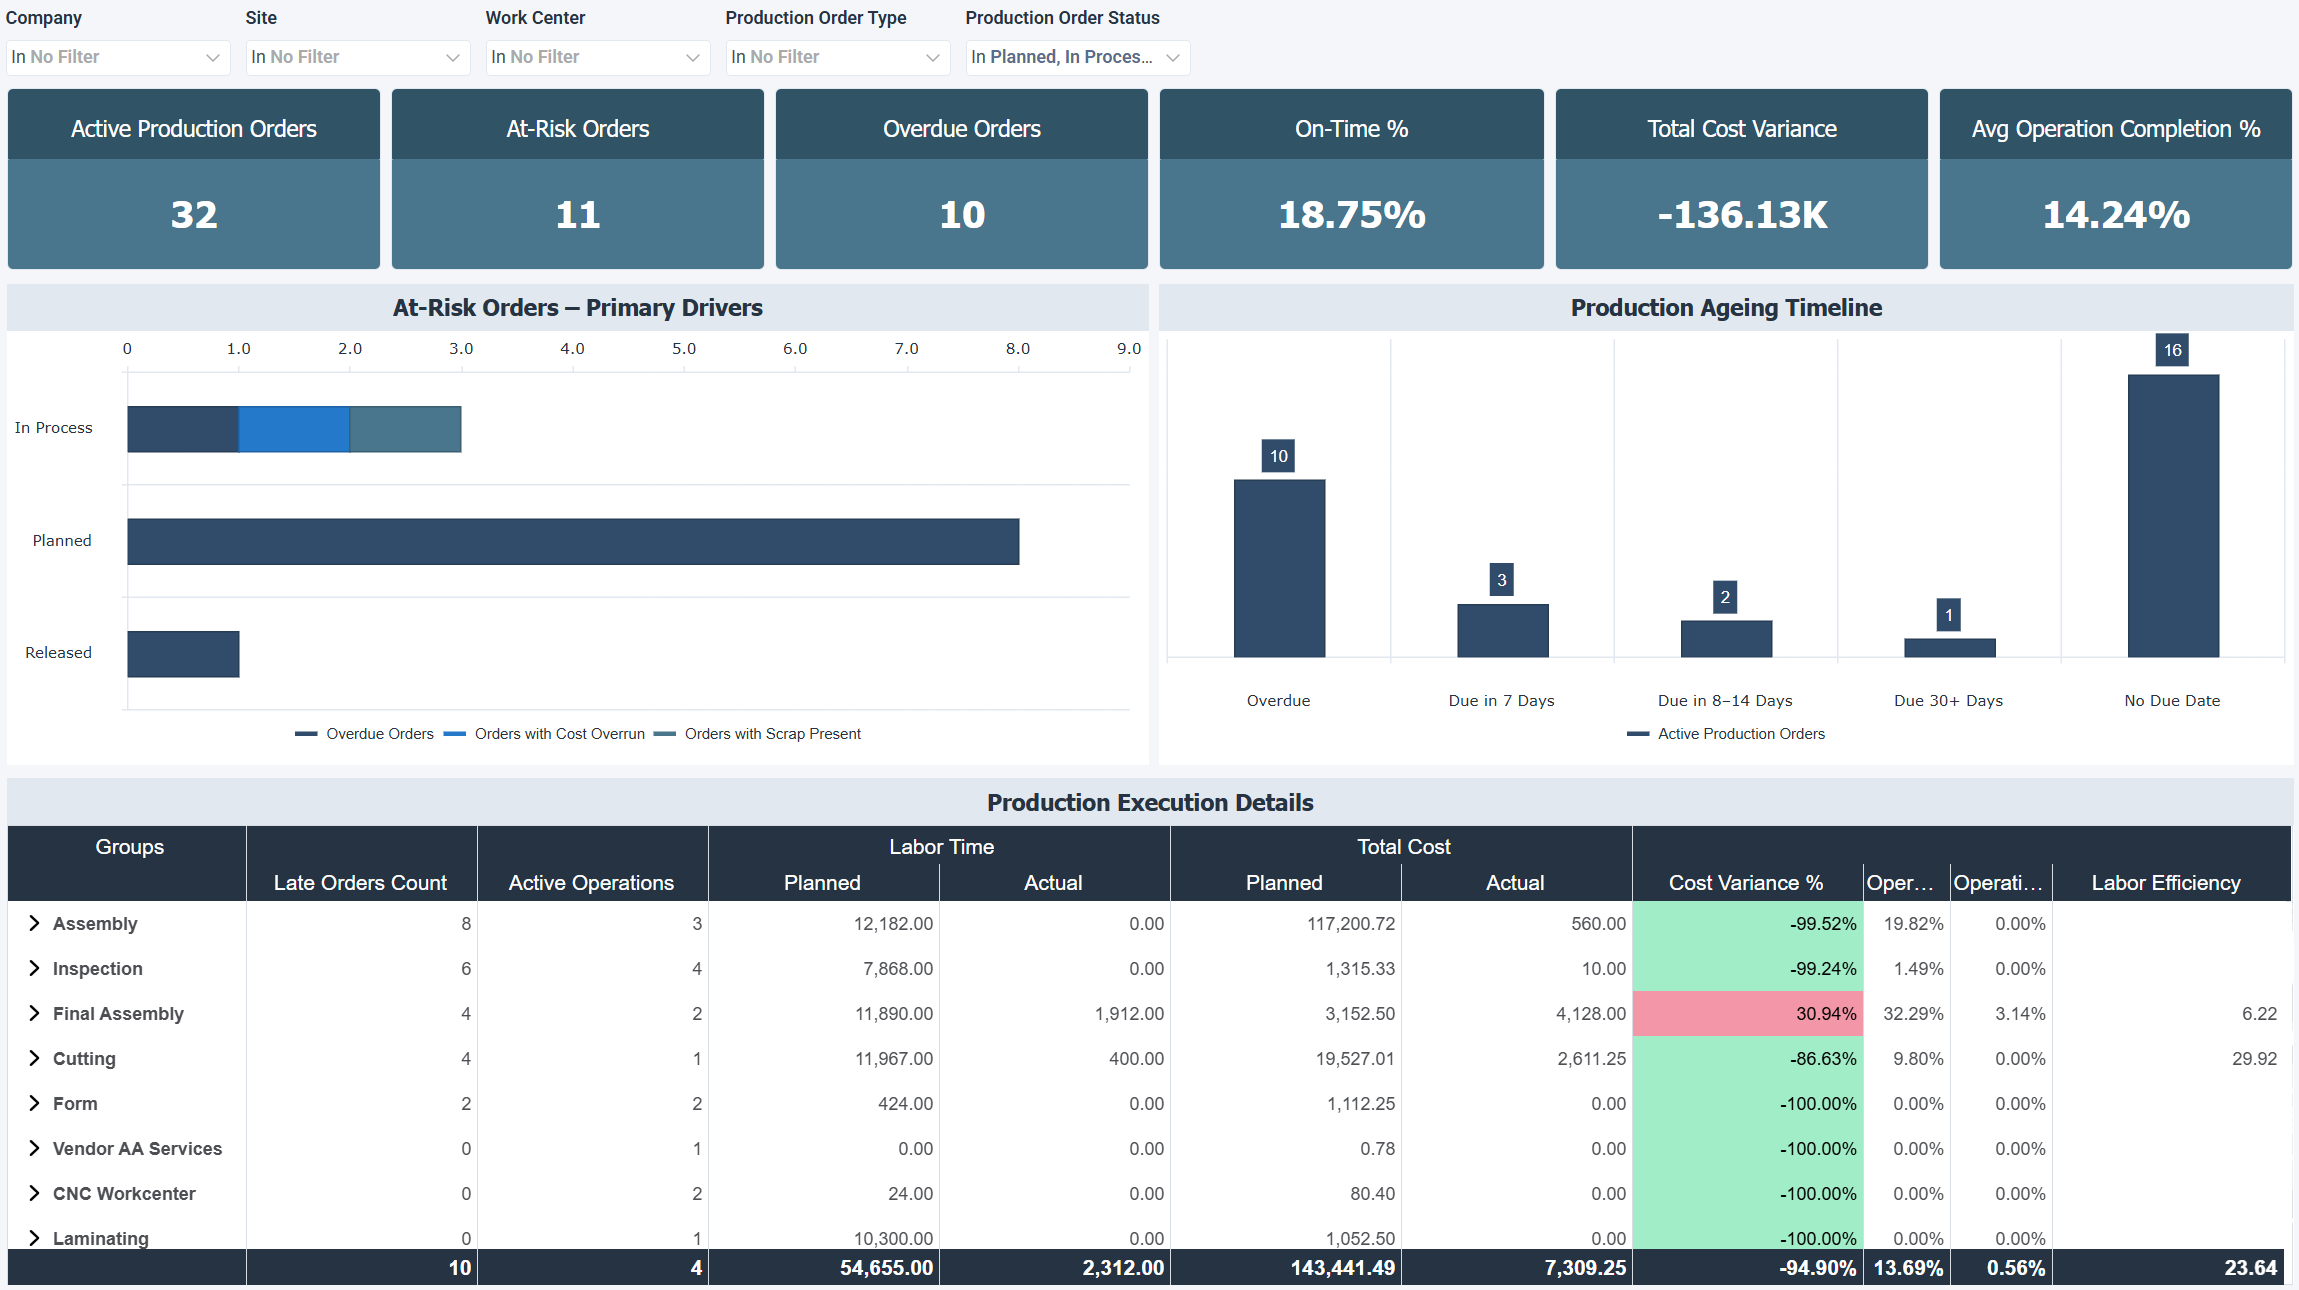
| At-Risk Orders – Primary Drivers | Stacked Bar | Breaks down at-risk orders by exception type: overdue, cost overrun, and scrap present, split by order status. Helps identify whether issues are scheduling-related, cost-related, or quality-related. |
| Production Ageing Timeline | Vertical Bar | Groups active production orders by due date bucket and overdue status. Highlights how long work has been sitting in the system without progressing. |
| Production Execution Details | Worksheet | Aggregated view by work center, showing late order count, active operations, planned vs actual labor time, planned vs actual cost, and key metrics including cost variance %, operation completion %, scrap %, and labor efficiency. |
Example dashboard
Filters
Use the filtering panel at the top of the dashboard to control which data is shown. The filters apply to all views and ensure the dashboard reflects the selections you choose.
- Company
- Site
- Work Center
- Production Order Type
- Production Order Status